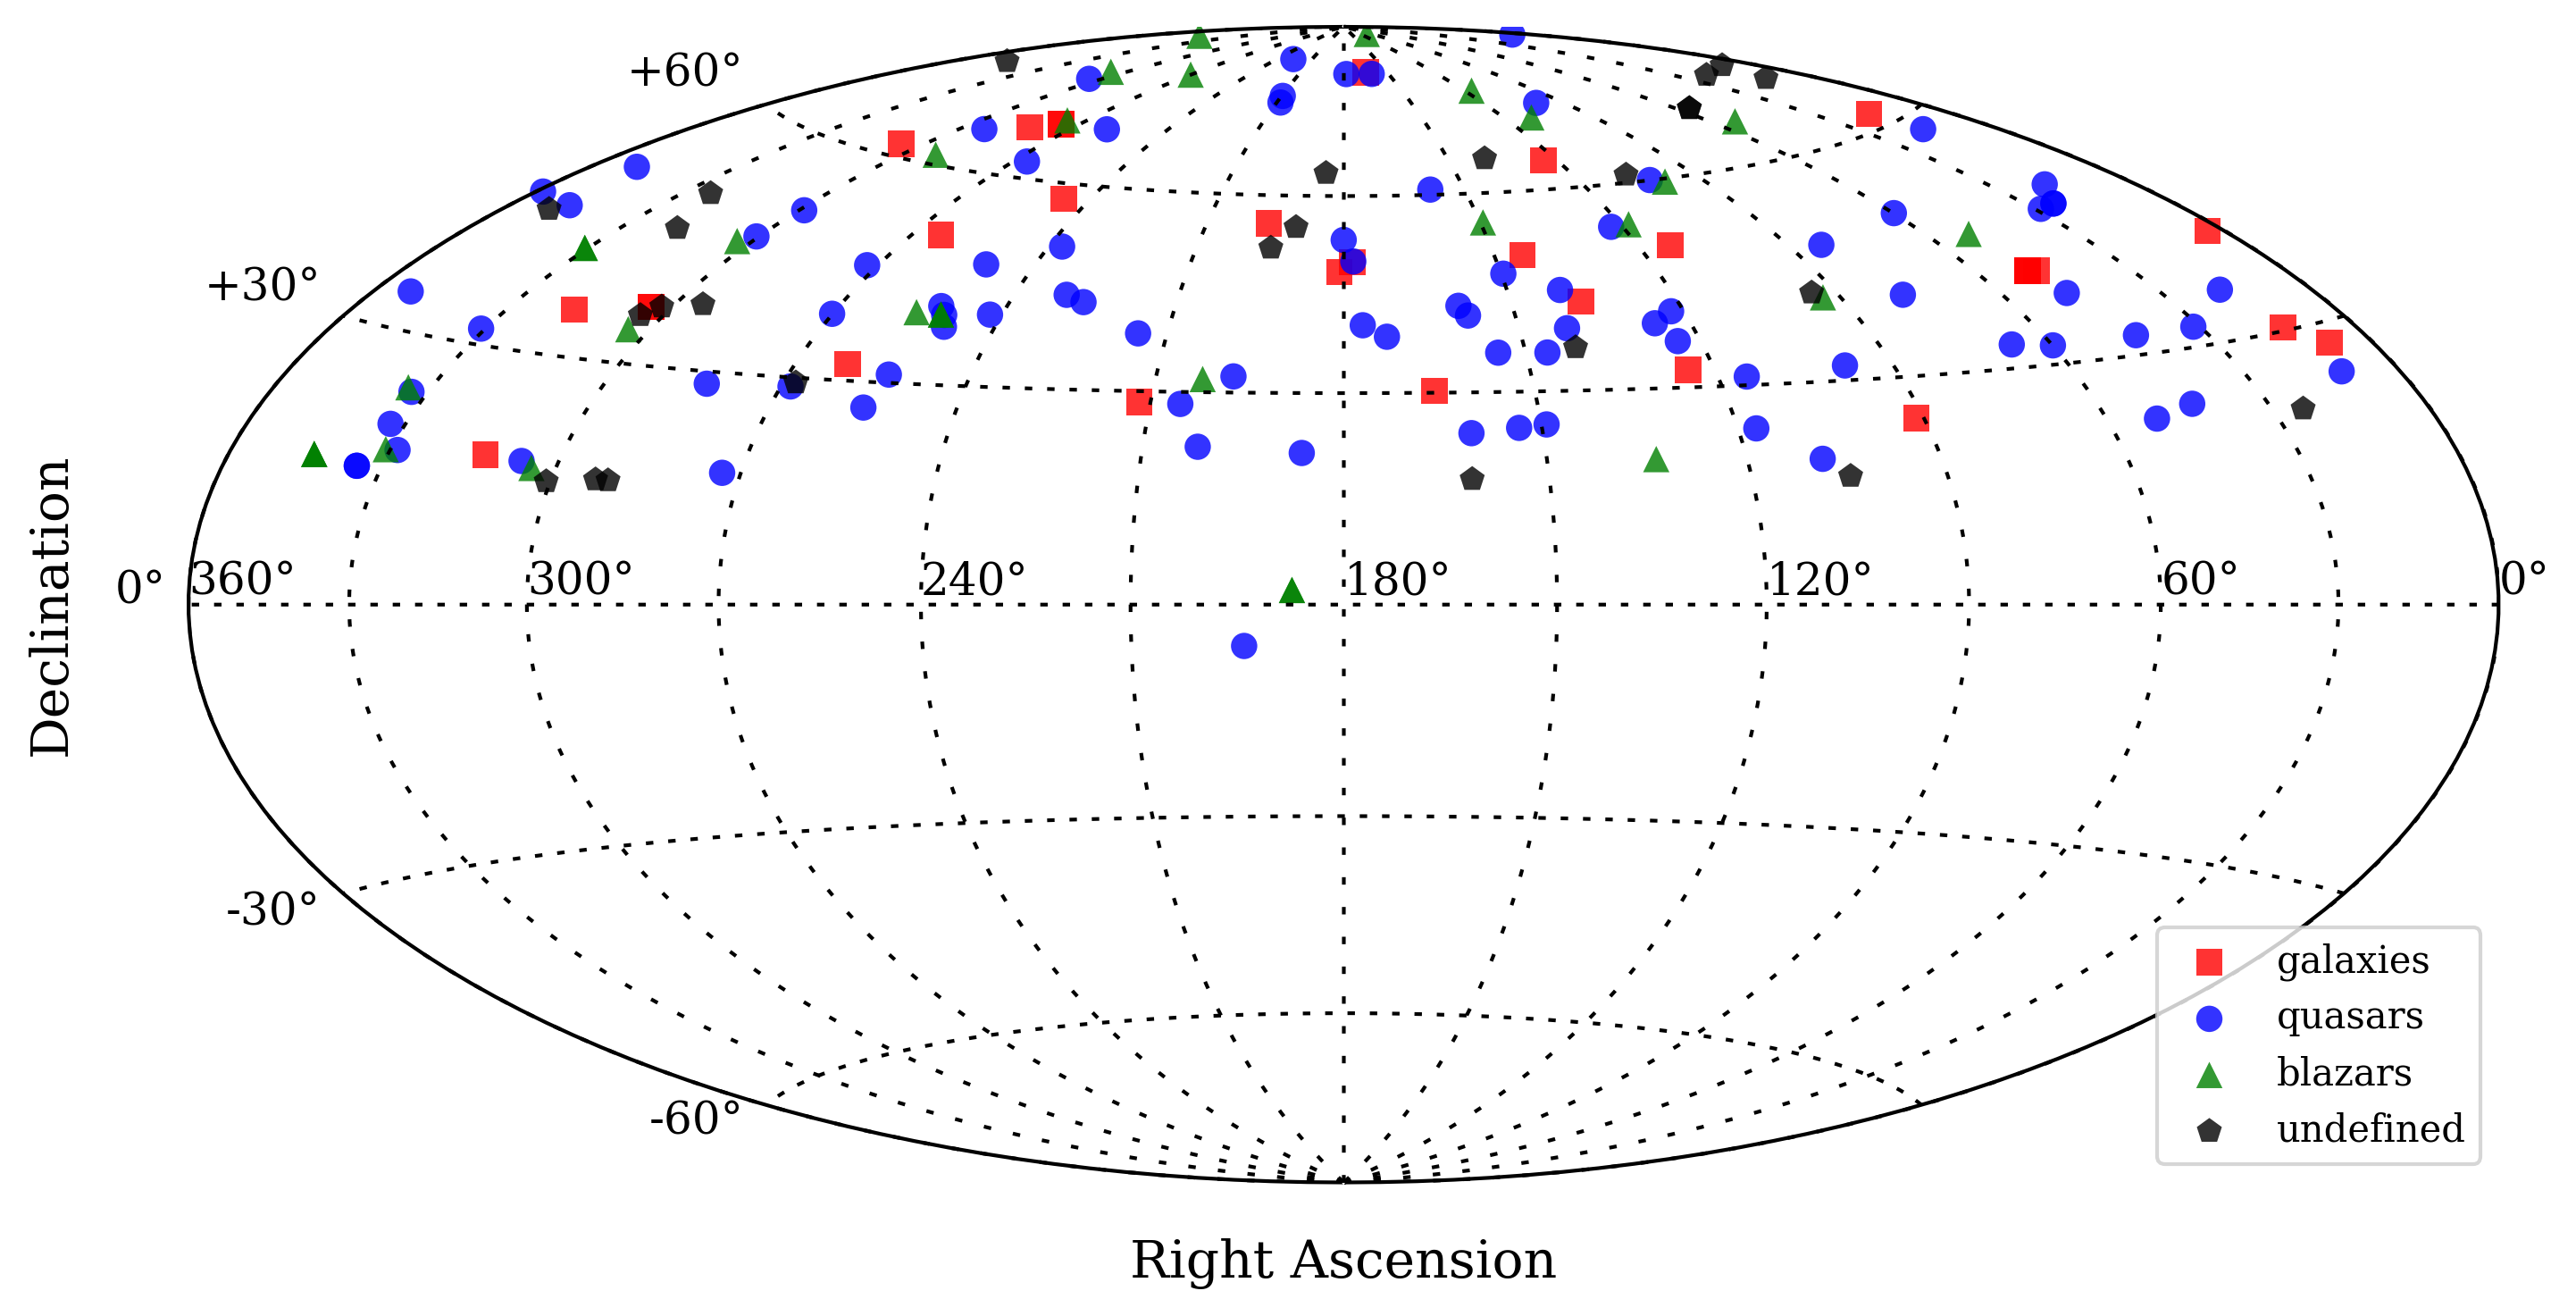
Figure 1. Sky distribution of the sources of this survey in Galactic coordinates.
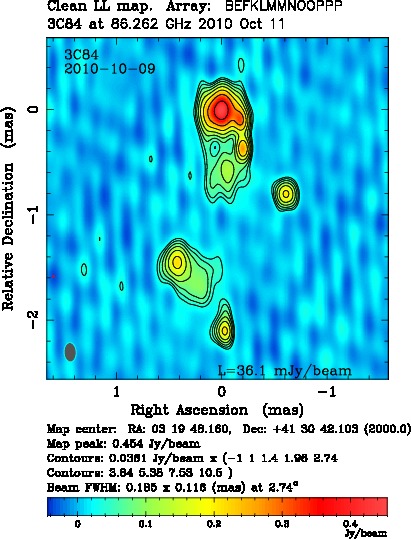
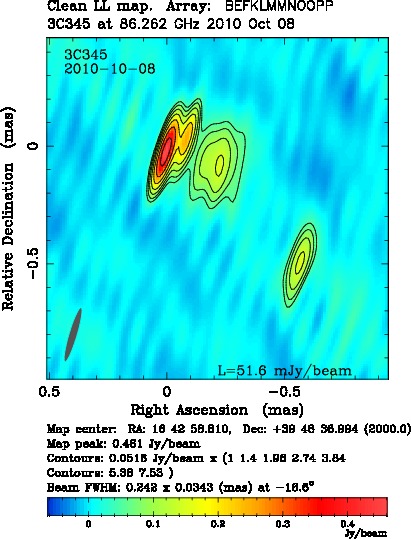
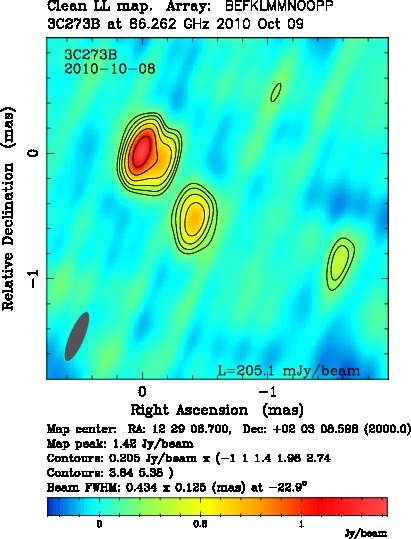
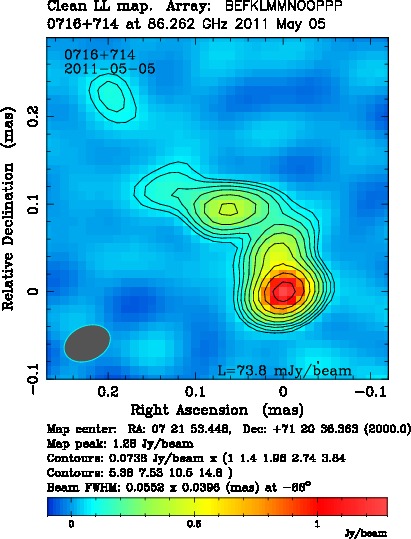
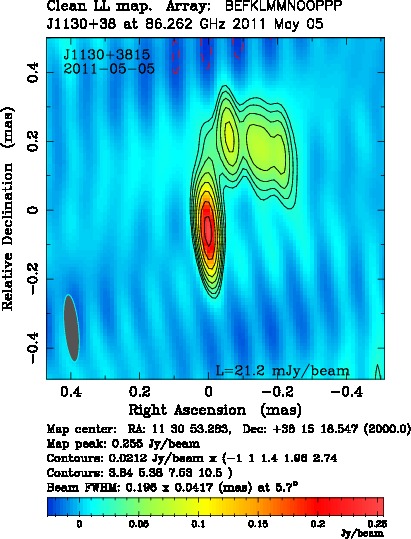
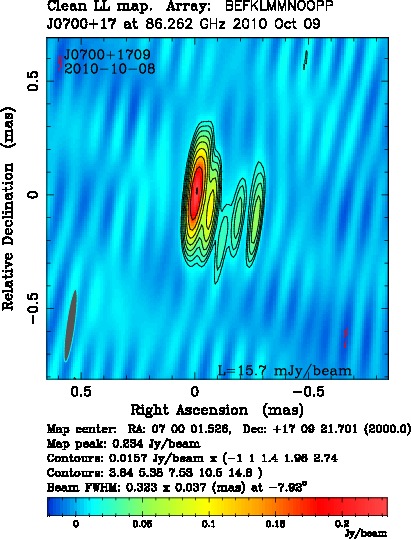
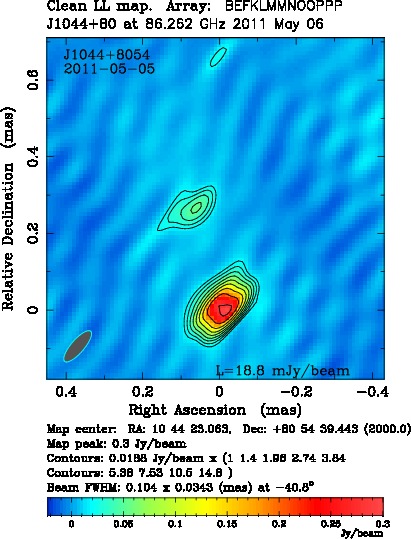
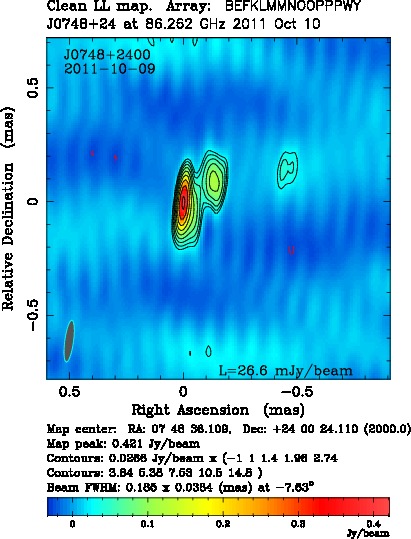
Figure 2. From left to right, first row: 3 mm maps of 3C 84, 3C 345, 3C 273B, and 0716+714. Second row: J1130+3815, J0700+1709, J1044+8054, and J0748+2400. The contouring of images is made at 3σrms×(-1, 1, √2, 2, ...) levels, with σrms representing the off-source r.m.s noise in the residual image. The well-known calibrator sources shown in the first row depict the image sensitivity and fidelity of 3 mm maps in this survey. A total of 174 contour maps of 162 unique sources imaged at 3 mm in this survey are presented in Image Parameters.
Very long baseline interferometry (VLBI) observations at 86 GHz (wavelength, λ = 3 mm) enable detailed studies to be made of compact radio sources at a resolution of ∼ (40–100) μas. This resolution corresponds to linear scales as small as 103–104 Schwarzschild radii and uncovers the structure of the jet regions where acceleration and collimation of the flow takes place.
To date, five 86 GHz VLBI surveys have been conducted with the total number of objects imaged reaching just over a hundred. No complete sample of objects imaged at 86 GHz has been established so far. A dedicated 86 GHz VLBI study of a larger sample of extragalactic radio sources was conducted in 2010-2011. In this web page, the results from a large global VLBI survey of compact radio sources carried out in 2010–2011 with the Global Millimeter VLBI Array (GMVA) is presented. The main goal of the survey was to extend the existing survey at 86 GHz to faint sources and to develop a comprehensive sample of ultra compact radio sources that are imaged at 86 GHz and to increase the VLBI imaging database; study the morphology and the distribution of brightness temperatures and to investigate collimation and acceleration of relativistic flows and to probe physical conditions in the vicinity of super massive black holes.
The survey data reach a typical baseline sensitivity of 0.1 Jy and a typical image sensitivity of 5 mJy/beam. A total of 162 unique compact radio sources have been observed in this survey and all the sources are detected and imaged. This survey has provided hybrid maps of 162 unique radio sources, increasing the total number of sources ever imaged with VLBI at 86 GHz by a factor of 1.5. For 138 objects, the survey provides the first ever VLBI images made at 86 GHz. With the present survey, the overall sample of compact radio sources imaged with VLBI at 86 GHz is representative down to ∼ 0.5 Jy for J2000 declinations of δ ≥ 15°.
Dedicated VLBI observations at 86 GHz are made with the GMVA and with the Very Long Baseline Array (VLBA) working in a stand-alone mode (VLBA also takes part in GMVA observations). The GMVA has been operating since 2002, superseding the operations of the Coordinated Millimeter VLBI Array and earlier ad hoc arrangements employed since the early 1980s. The GMVA carries out regular, coordinated observations at 86 GHz, providing good quality images with a typical angular resolution of ∼ (50–70) μas. The array comprises up to 16 telescopes located in Europe, the USA and Korea operating at a frequency of 86 GHz. The following telescopes took part in the GMVA observations for this survey in 2010 and 2011: eight VLBA antennae equipped with 3 mm receivers, the IRAM (Institut de Radio Astronomie Millimétrique) 30 m telescope on Pico Veleta (Spain), the phased six-element IRAM interferometer on Plateau de Bure (France), the MPIfR (Max-Planck-Institut für Radioastronomie) 100 m radio telescope in Effelsberg (Germany), the OSO (Onsala Space Observatory) 20 m radio telescope at Onsala (Sweden), the 14 m telescope in Metsähovi (Finland), and the OAN (Observatorio Astronómico Nacional) 40 m telescope in Yebes (Spain).
The survey target source list has been compiled from the MOJAVE (Monitoring of Jets in Active Galactic Nuclei with VLBA Experiments) sample, using the following selection criteria:
| a) | 15 GHz correlated flux density, Sc ≥ 0.5 Jy on baselines of ≥ 400 Mλ; | |
| b) | compactness at longest spacings, Sc /SVLBA ≥ 0.4 where S VLBA is the 15 GHz total clean flux density; | |
| c) | declination δ ≥ 15°. |
The survey observations have been made over a total of six days (144 hours), scheduled within three separate GMVA sessions. Up to 14 telescopes took part in the observations. The observations were typically scheduled with five scans per hour, each of 300 seconds in duration. Gaps of five to ten minutes were introduced between the scans for antennae pointing at Effelsberg (Eb) and Pico Veleta (Pv) and for phasing of the Plateau de Bure (Pb) interferometer. This observing scheme yielded the total of 720 scans distributed between 174 observing targets (162 unique radio sources), ensuring that each object was observed with four to five scans distributed over a wide range of hour angles. Despite the rather modest observing time spent on each target, the large number of participating antennae ensured good uv-coverages for all survey sources down to the lowest declinations. The observations were performed at a sampling rate of 512 Mbit/sec and with a two–bit sampling. There were four intermediate frequencies (IFs) in October 2010 (Epoch A) and October 2011 (Epoch C), and two IFs in May 2011 (Epoch B). The typical baseline sensitivities for a 20–second integration time are ∼ 0.05 Jy on the Pb–Pv baseline, ∼ 0.1 Jy on the Eb–Pv baseline, ∼ 0.2 Jy on the baselines between Eb/Pv and other antennae, and ∼ 0.4 Jy on the baselines between the VLBA antennae. With such baseline sensitivities and an on-source integration time of about 20 minutes, the typical point source sensitivity of a survey observation is ∼ 5 mJy/beam, which is sufficient to obtain robust images of most of the survey sources. The data were correlated using the DiFX correlator installed at the Max-Planck-Institut für Radioastronomie (MPIfR) at Bonn. After correlation, the data were loaded into AIPS (Astronomical Image Processing System) in which the phase and amplitude calibration was done. The overall amplitude calibration error for the observations is about 25 %.
For more details of the survey, please see Nair et al. (2019) and references therein.
| Epoch1 | Date2 | Nobj3 | Pol.4 | wbit5 | BW6 | nch7 | nbit8 | Telescopes |
| A | Oct 2010 | 68 | LCP | 512 | 128 (4IF x 32) | 32 | 2 | 8 VLBA+(Eb,On,Mh,Pb,Pv) |
| B | May 2011 | 46 | LCP | 512 | 128 (2IF x 64) | 64 | 2 | 8 VLBA+(Eb,On,Pb,Pv,Mh) |
| C | Oct 2011 | 60 | LCP | 512 | 128 (4IF x 32) | 32 | 2 | 8 VLBA+(Eb,On,Pb,Pv,Mh,Ys) |
1survey epoch, 2observing date, 3number of objects observed, 4polarization, 5recording bit rate [Mbps], 6total bandwidth (number of IF bands x IF bandwidth) [MHz], 7number of frequency channels per IF band, 8correlator sampling [bits].
| Name1 | Code2 | D [m]3 | G [K/Jy]4 | Tsys [K]5 | ηA6 | SEFD [Jy]7 | Δ512,20 [mJy]8 | σrms [mJy]9 |
| Brewster | Br | 25 | 0.033 | 110 | 0.22 | 3333.3 | 23.44 | 164.09 |
| Effelsberg | Eb | 80† | 0.140 | 140 | 0.08 | 1000 | 12.84 | 89.87 |
| Fort Davis | Fd | 25 | 0.039 | 140 | 0.22 | 3589.7 | 24.32 | 170.28 |
| Kitt Peak | Kp | 25 | 0.028 | 100 | 0.22 | 3571.4 | 24.26 | 169.85 |
| Los Alamos | La | 25 | 0.042 | 120 | 0.22 | 2857.1 | 21.70 | 151.91 |
| Metsähovi | Mh | 14 | 0.017 | 300 | 0.3 | 17647.1 | 53.94 | 377.55 |
| Mauna Kea | Mk | 25 | 0.019 | 100 | 0.22 | 5263.2 | 29.45 | 206.18 |
| North Liberty | Nl | 25 | 0.022 | 130 | 0.22 | 5909.1 | 31.21 | 218.47 |
| Onsala | On | 20 | 0.049 | 250 | 0.43 | 5102 | 29.00 | 203.00 |
| Owens Valley | Ov | 25 | 0.035 | 120 | 0.22 | 3428.6 | 23.77 | 166.41 |
| Plateau de Bure | Pb | 36‡ | 0.22 | 180 | 0.7 | 818.2 | 11.61 | 81.29 |
| Pie Town | Pt | 25 | 0.044 | 100 | 0.22 | 2272.7 | 19.36 | 135.52 |
| Pico Veleta | Pv | 30 | 0.153 | 100 | 0.6 | 653.6 | ... | ... |
| Yebes | Ys | 40 | 0.09 | 150 | 0.2 | 1666.7 | 16.58 | 116.03 |
1telescope name, 2 abbreviation for the telescope name, 3 diameter, 4 antenna gain, 5 zenith system temperature, 6 aperture efficiency, 7 zenith SEFD, 8 sensitivity on the baseline to Pico Veleta, for a 20 sec fringe fit interval and 512 Mbps recording rate, 9 7σ detection threshold. Notes: † effective diameter at 86 GHz, ‡ effective diameter in the phased array mode.