| Observation epoch | 2010-10-01 |
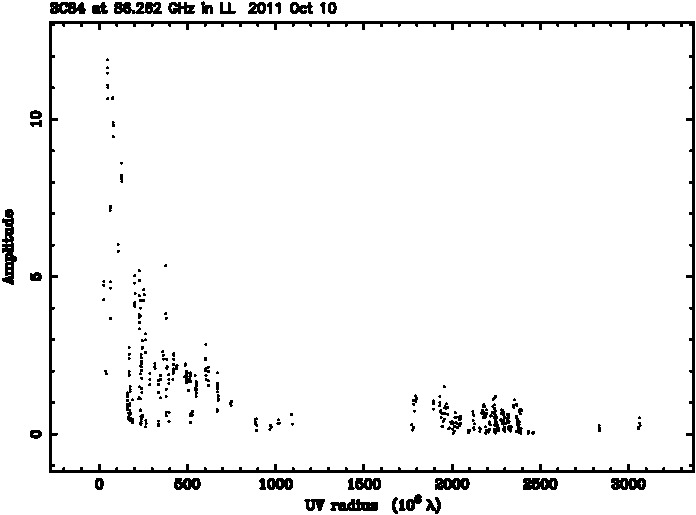
S86 GHzTotal single dish flux density measured at 86 GHz obtained from pointing and calibration scan measurements at Pica Veleta or Plateau de Bure [Jy] | 12.06 |
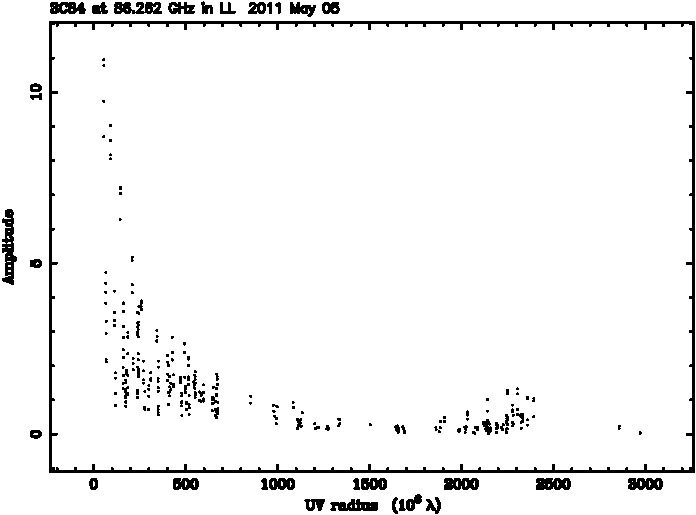
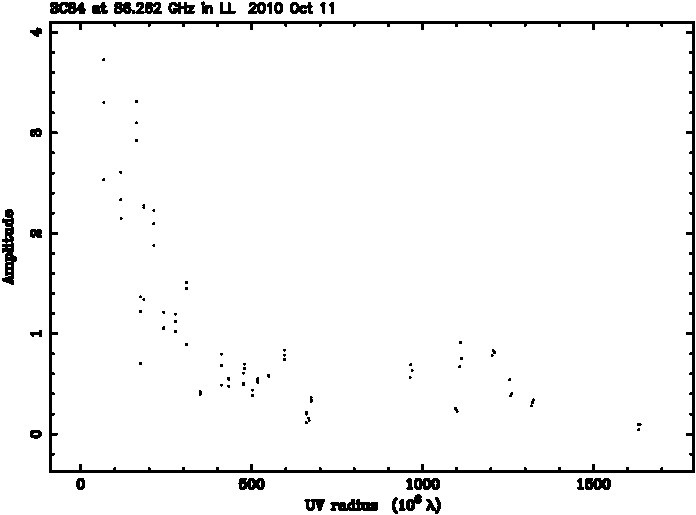
SS [Jy]Correlated flux density [Jy] measured on projected baseline length listed in the next column | 4.69 ± 0.181 |
BS [Mλ]Projected baseline length [Mλ] for the measured flux density listed in the previous column | 26 |
SL [Jy]Correlated flux density [Jy] measured on projected baseline length listed in the next column | 0.506 ± 0.054 |
BS [Mλ]Projected baseline length [Mλ] for the measured flux density listed in the previous column | 3064 |
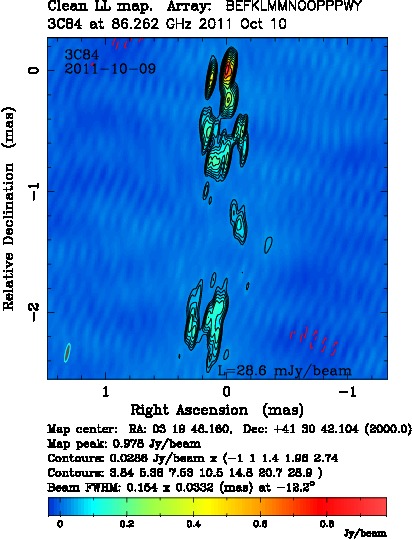
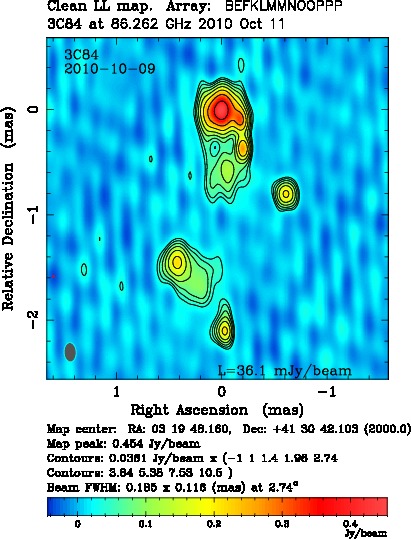
Ba [μas]Major axis of the restoring beam [μas] | 155 |
Bb [μas]Minor axis of the restoring beam [μas] | 33 |
BPA [degrees]Position angle of the major axis [degrees] | -12.2 |
St [mJy]Total clean flux density [mJy] | 7677 |
Sp [mJy/beam]Peak flux density [mJy/beam] | 978 |
σ [mJy/beam]Off-source r.m.s. noise in the residual image [mJy/beam] | 10 |
ξrQuality factor of the residual noise in the image | 1.16 |