


Selected Topics
Multi-frequency Linear and Circular polarisation light curves (RadipoPol)
We have re-designed the analysis pipeline and we are able to recover Linear polarisation at 4 frequencies and Circular polarisation at 2 frequencies. We are working towards 4 CP frequencies as well. We have cerated a database of multi-band LP and CP light curves for studying the physics at the emitting plasmoids. A mean uncertainty for the LP and CP can be as low as 0.1% while for the angle 1-2o.

Full Stokes radiative transfer modelling of radio light curves
We have developed a code that simulates a realistic relativistic jet of magnetised plasma for modelling the observed multi-band polarisation light curves (Figure 1). The code treats linear a circular polarisation alike by doing a formal radiative transfer of all four Stokes parameters.
Result: Our code has been used successfully in the case of 3C454.3 (Figure 2). We have identified the jet parameters and physical conditions that exactly reproduce the dynamics of Linear and Circular polarisation.

Figure 1: The modelled jet
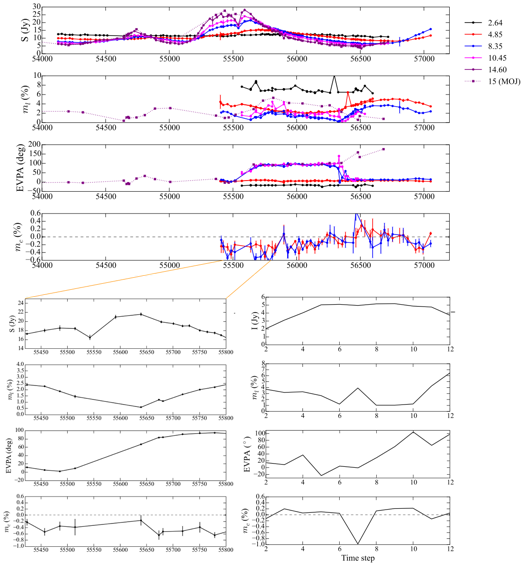
Figure 2: Comparison of synthetic and observed polarisation curves.
γ-ray emission site
Karamanavis et al. 2016,A&A, 590, 48
Fuhrmann et al. 2014, MNRAS, 441, 1899
From cross-correlation of radio and gamma-ray light curves we ca estimate the distance between radio and gamma-ray emission site (Figure 1). Then the cross-correlation of the radio bands can tell us the distance of the radio “core” rom the jet apex. Combining the two puts a limit for the gamma-ray emission site (Figure 2). This all relies on time shifts caused by opacity. In the case of 3C454.3 we found that the production of gamma rays is located at least as far as ∼0.8–1.6 pc from the supermassive black hole (SMBH), i.e. at the outer edge of the broad-line region (BLR) or beyond. For PKS 1502+106 we find similarly that the gamma-ray active region is situated about 2 pc away from the jet base.

Figure 1: Delays between radio frequencies.

Figure 2: A schematic explaining the idea behind the calculation of the gamma ray emitting site.
Direct connection between the structural evolution of jets and the variability curve?
We examined the structural evolution of PKS 1502+106 with mm VLBI during a prominent gamma-ray and radio flare. We find a close connection between the ejection of new component and broadband variability (Figure 1), traced with both VLBI and single dish techniques.

Figure 1: The flare in different energy bands.
The unification of the SED variability pattern
Angelakis et al. 2012JPhCS.372a2007A; 2012 Fermi & Jansky Proceedings - eConf C1111101
The apparently vast number of shapes in variability pattern seen in the monthly sample radio SEDs, can be classified into a small number of behaviours that can be reproduced easily with a combination of a steady state jet and a sequence of high frequency appearing components.
We assume a two-component principal system located at z = 0. The assumed system consists of:
-
‣A power law quiescence spectrum with α ≈ −0.5 is this what chris is assuming. This spectrum can be seen as the manifestation of an optically thin diffuse emission com- ing from a relaxed large scale jet or even a population of aged electron that have caused a recent flaring event.
-
‣ A convex synchrotron self-absorbed spectrum representative of an outburst superimposed on the quiescence part.


-
‣The position of the shaded areas relative to the high frequency peak (i.e. the peak of the outburst). This parameter denotes the relative position of the centre of our band-pass with respect to the source spectrum.
-
‣The width of the shaded areas relative to the width of the bridge (the total minimum) between the optically thick part of the outburst and the steep part of the quiescence spectrum. This parameter is actually denoting the fraction of the that the bandpass can sample.

On the basis of these assumptions,
-
‣The redshift modulus : Let us assume a principal system as shown in the Figure lying at z = 0 and a band-pass between 2 and 143 GHz(in observer’s frame). For this particular case the peak of the outburst is around 200 GHz. If the source was red- shifted the relative position of the band-pass would change and a different part of the spectrum would be sampled with the same facility. This is elegantly depicted by blue-shifting the band-pass instead of red-shifting the spectrum.
-
‣ The intrinsic properties modulus: Different sources with different values of certain parameters show different spectral characteristics:
-
-Different peak frequency of the SSA spectrum of the outburst
-
-Different peak flux density excess of the outburst relative to the quiescence spectrum
-
- Different broadness of the valley
-
- Different broadness of the SSA spectrum of the outburst
Is the gamma-ray and the radio producing mechanisms related?
We developed a maximum-likelihood analysis to account for the limitations of our sample and investigated the relation of the integrated fluxes in the two bands. Significant correlations were found between the highest radio frequencies (142 and 86 GHz) and the gamma rays. This is evidence that the γ-ray emission is produced very close to (or in the same region as) the mm-band emission region.

Flare Decomposition algorithm and Multi-wavelength Variability Doppler factors.
We developed a flare decomposition algorithm that treats and parametrizes each variability event separately. The big advantage of the approach is that it allows for different variability mechanisms to operate in the same light curve. An example of its successful application is the computation of Multi-wavelength Variability Doppler factors which are then compared to blazar population models (Figure 1).

Figure 1:The Doppler factors from different methods.