
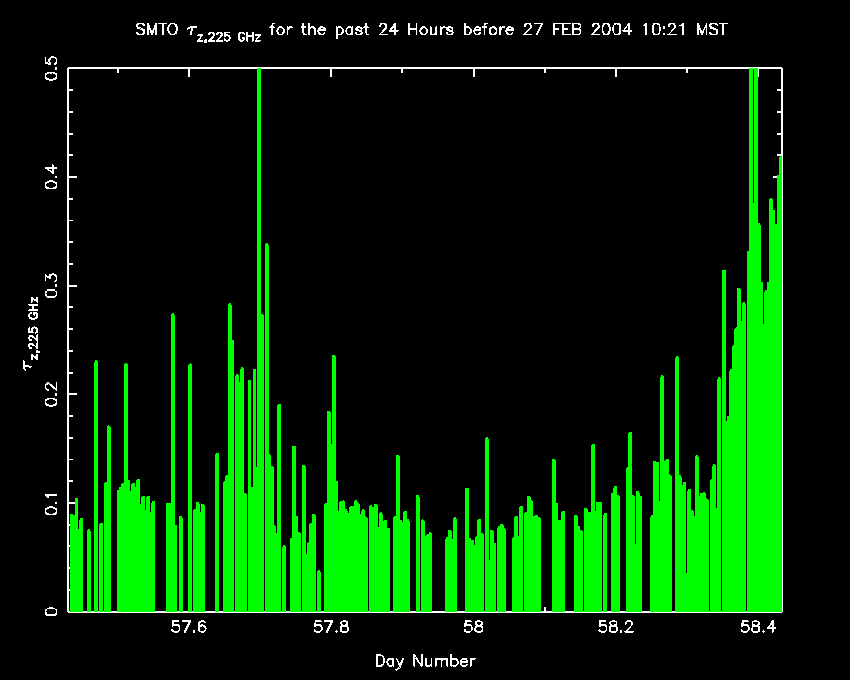
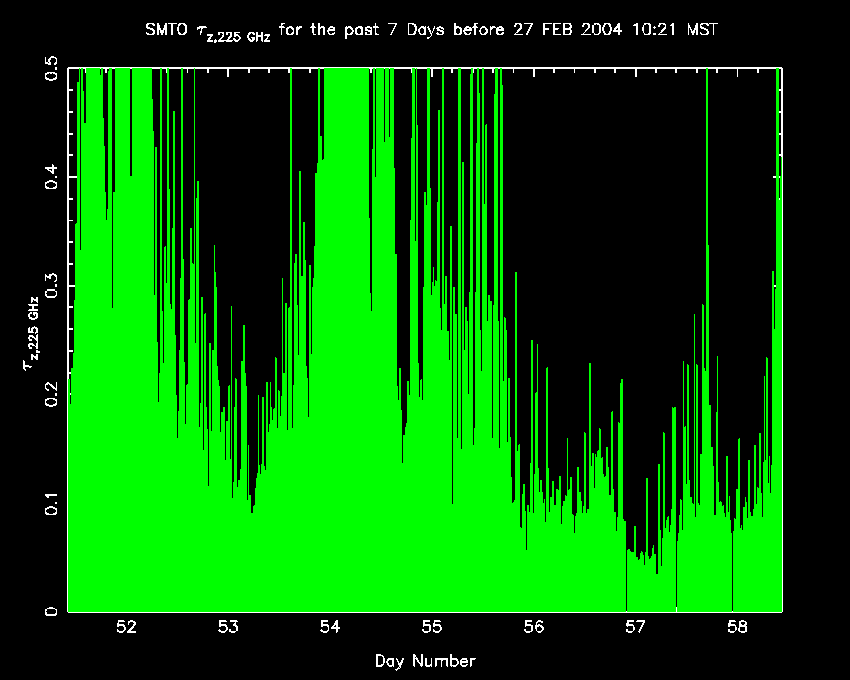
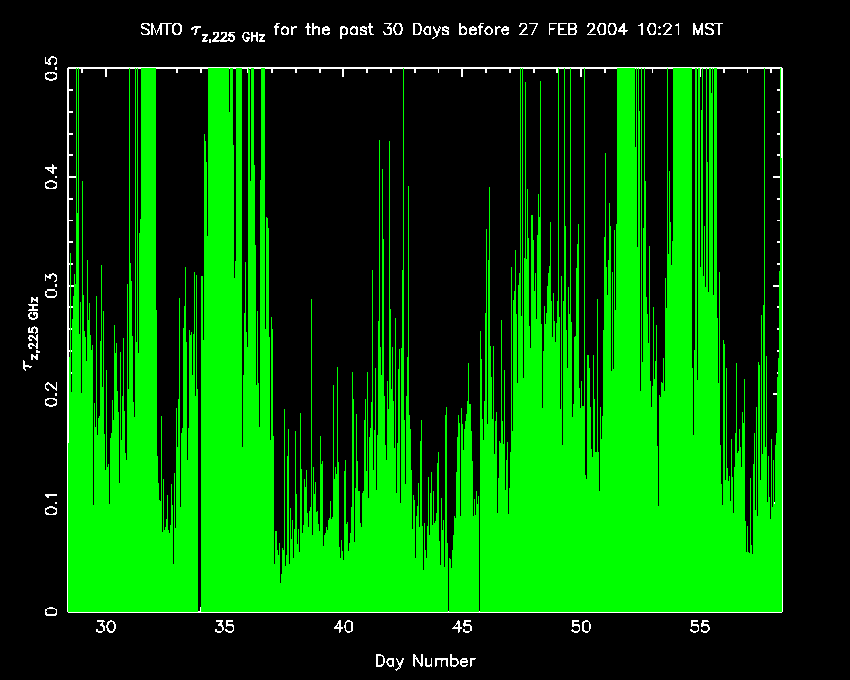
You can also view the tau values measured during the last day (GIF / PS), last week (GIF / PS), last two weeks (GIF / PS) and last 30 days (GIF / PS).
SMT 225 GHz radiometer data and statistics are available online in monthly or yearly format, and in either GIF or Postscript output, starting from March 1995 to the present.
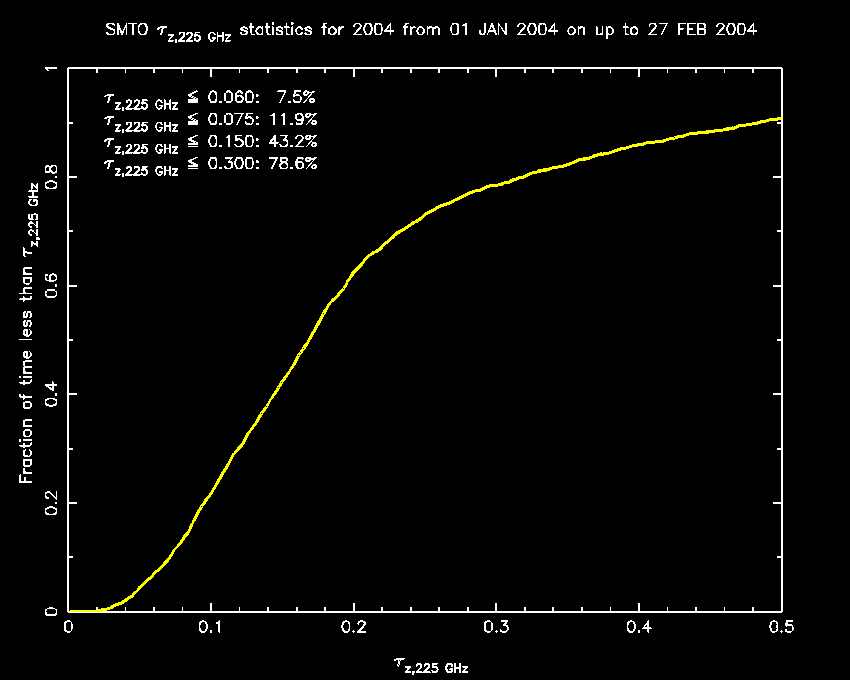
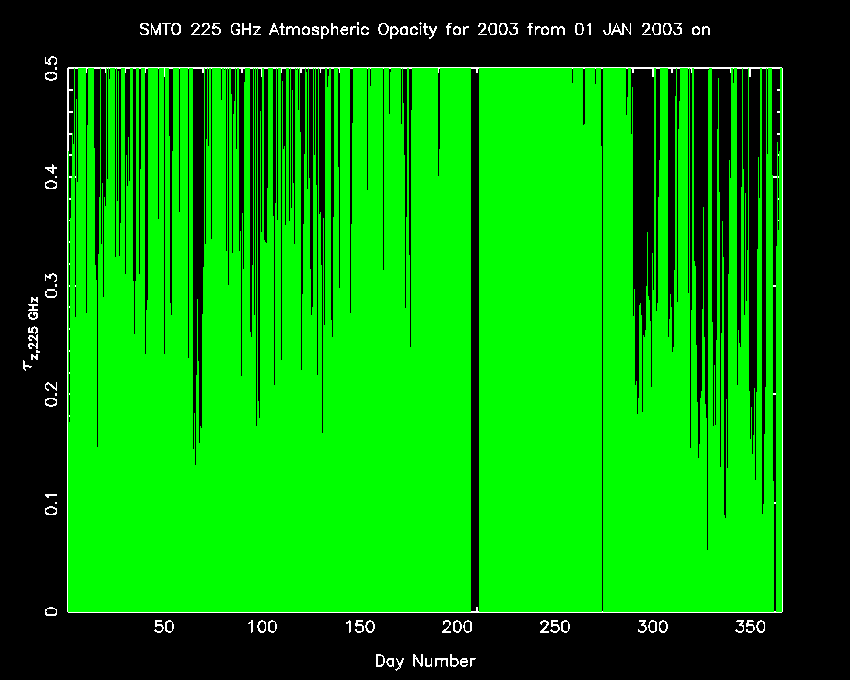
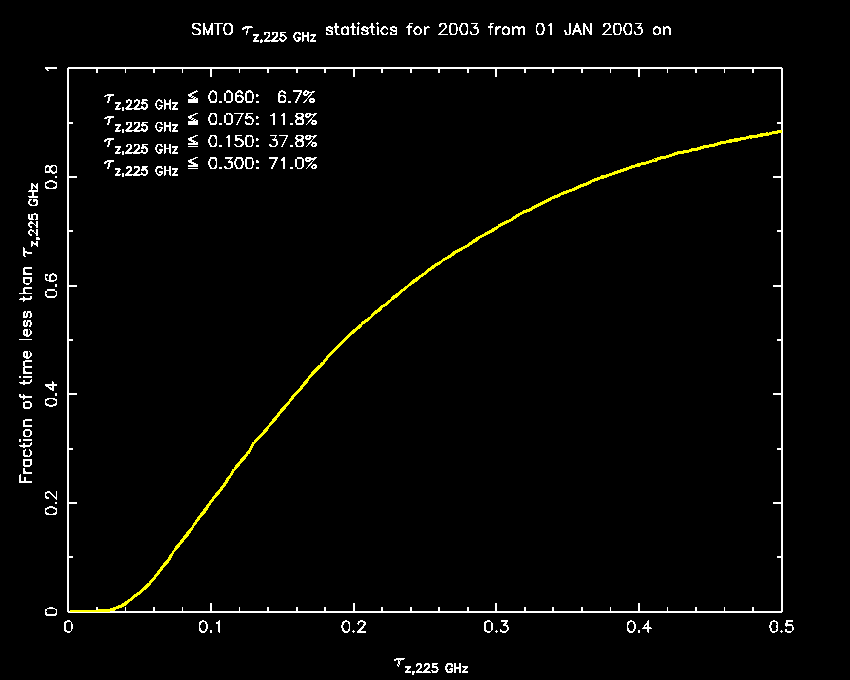
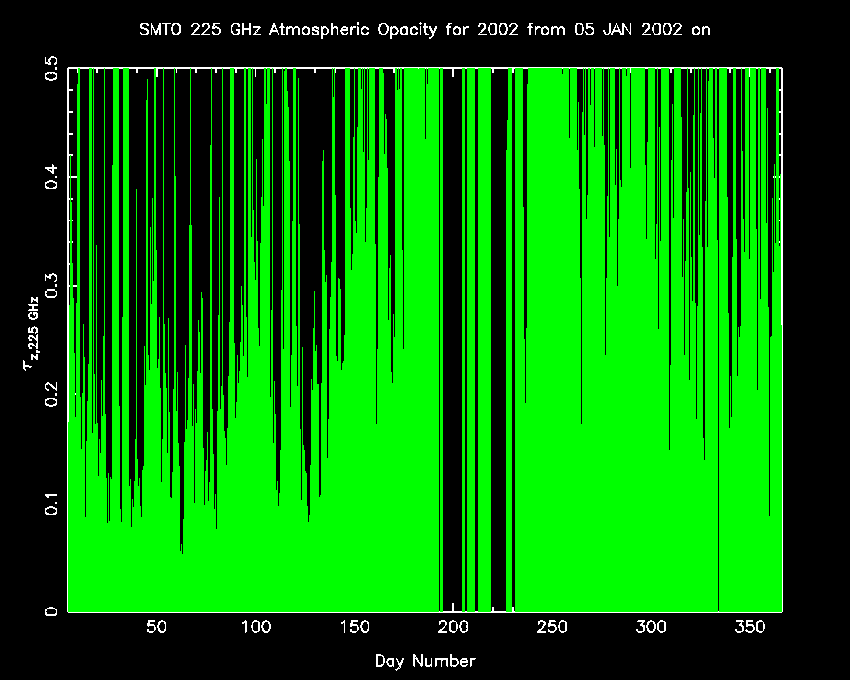
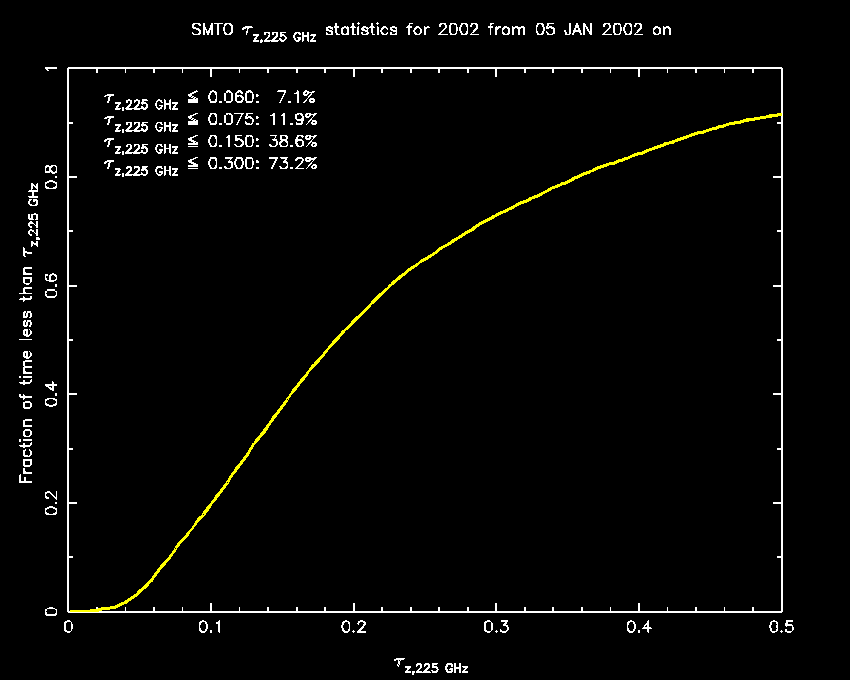
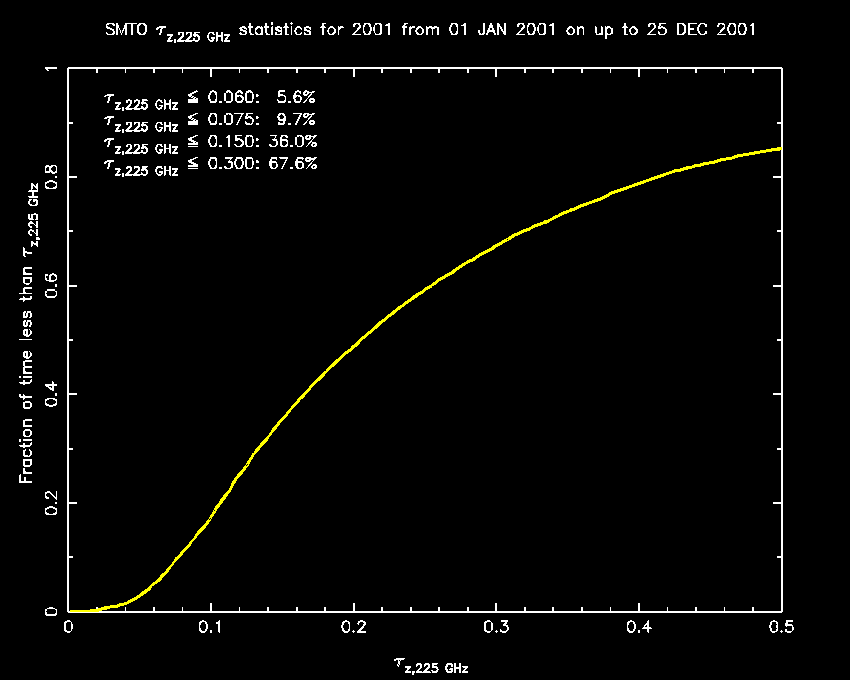
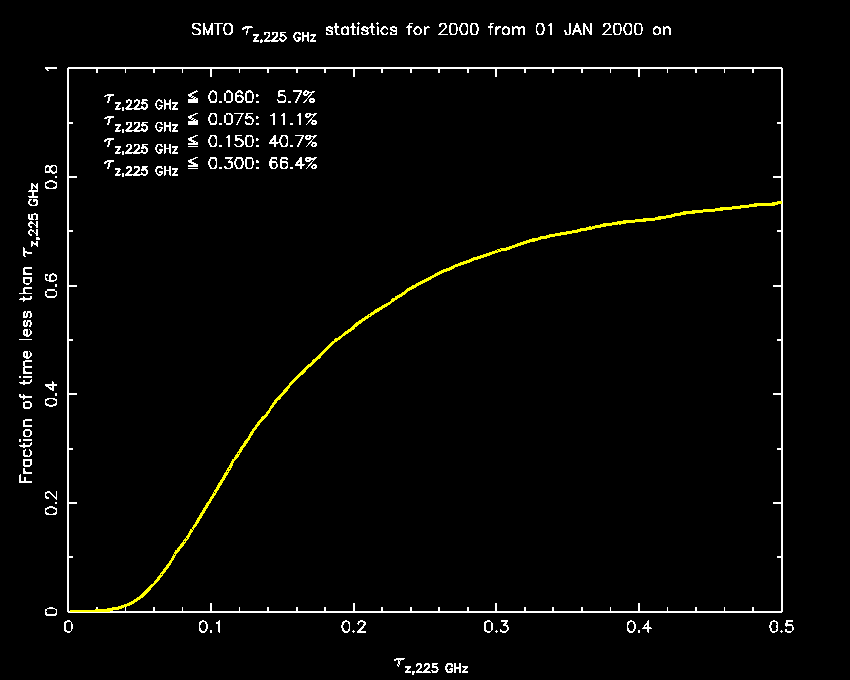
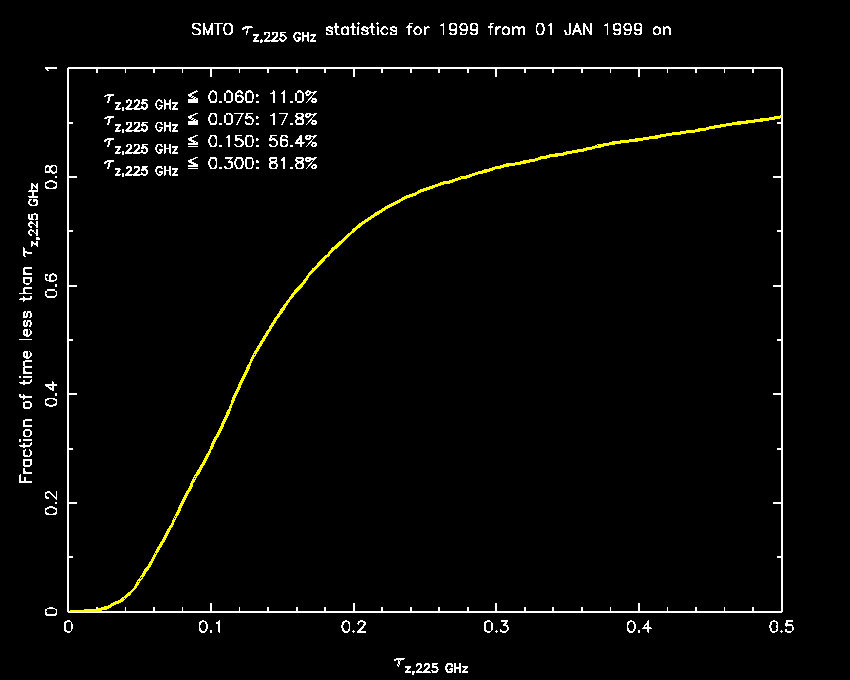
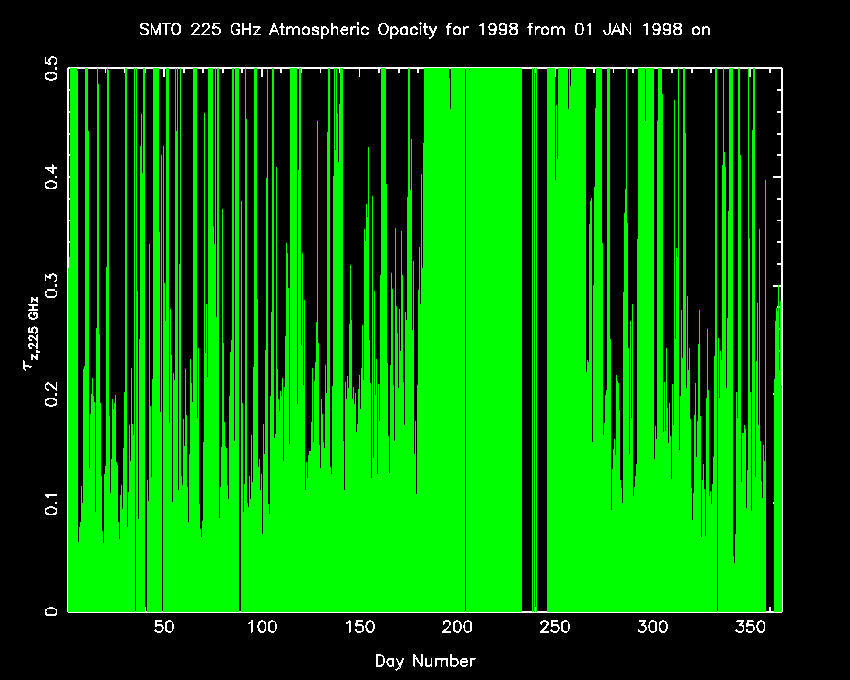
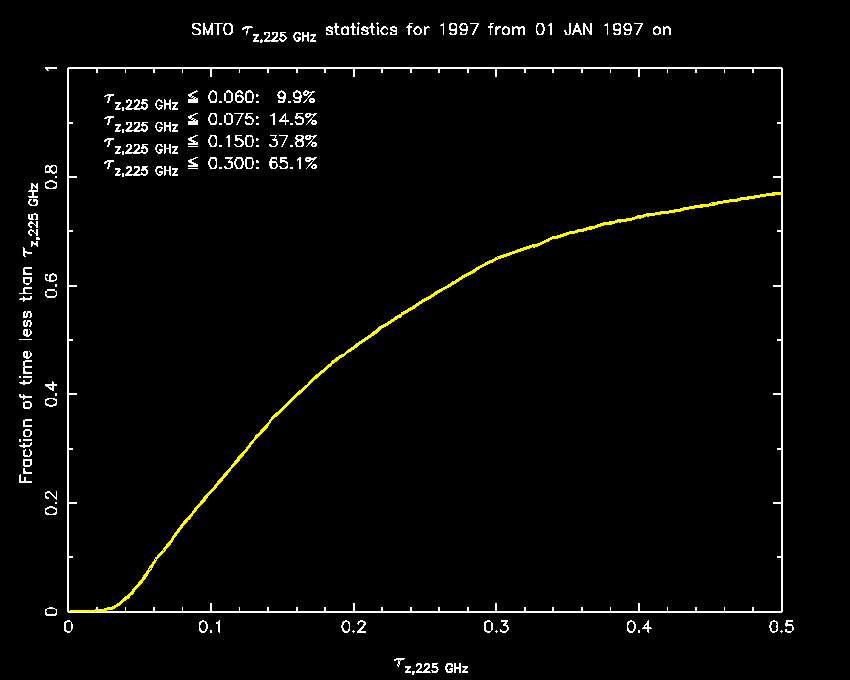
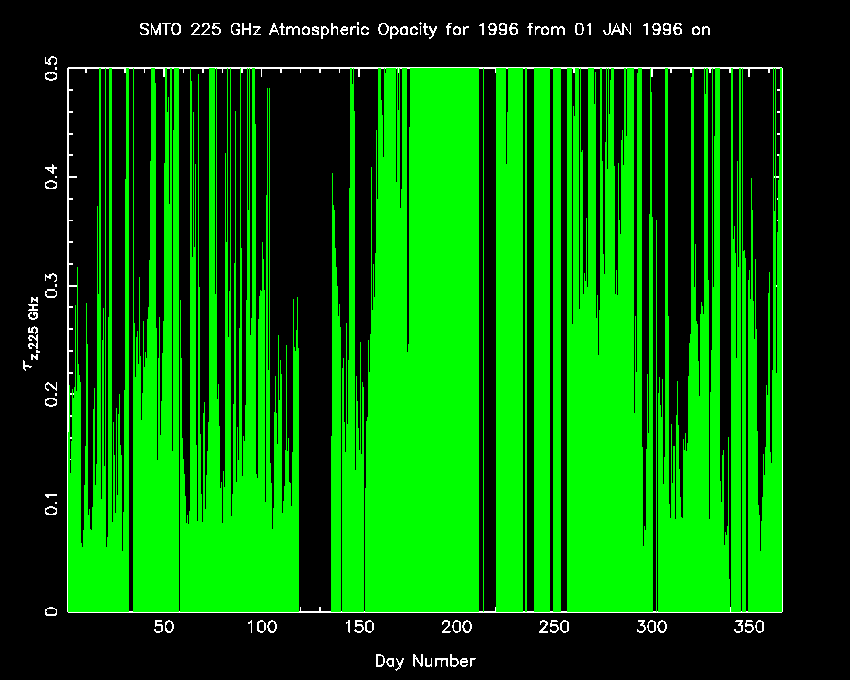
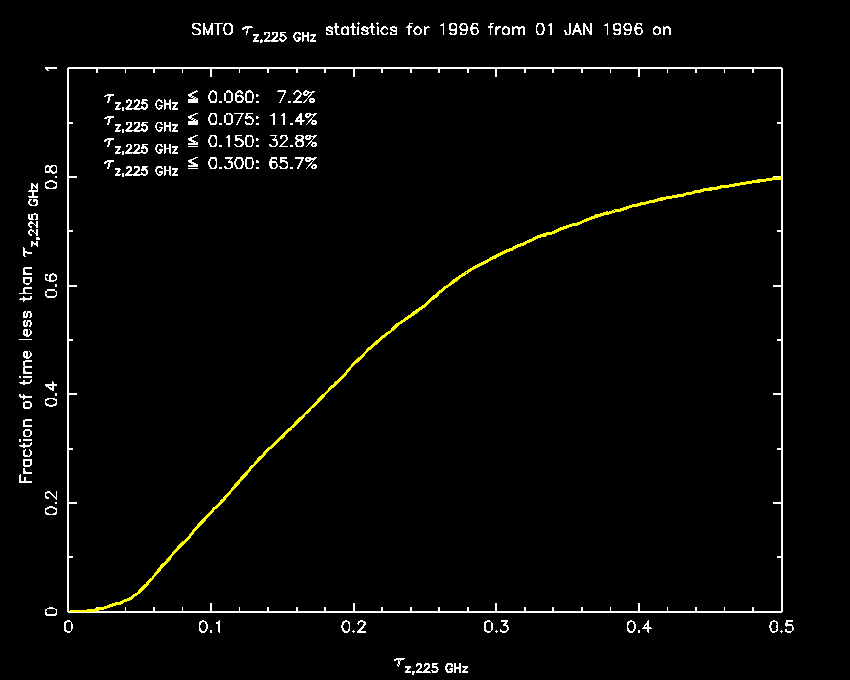
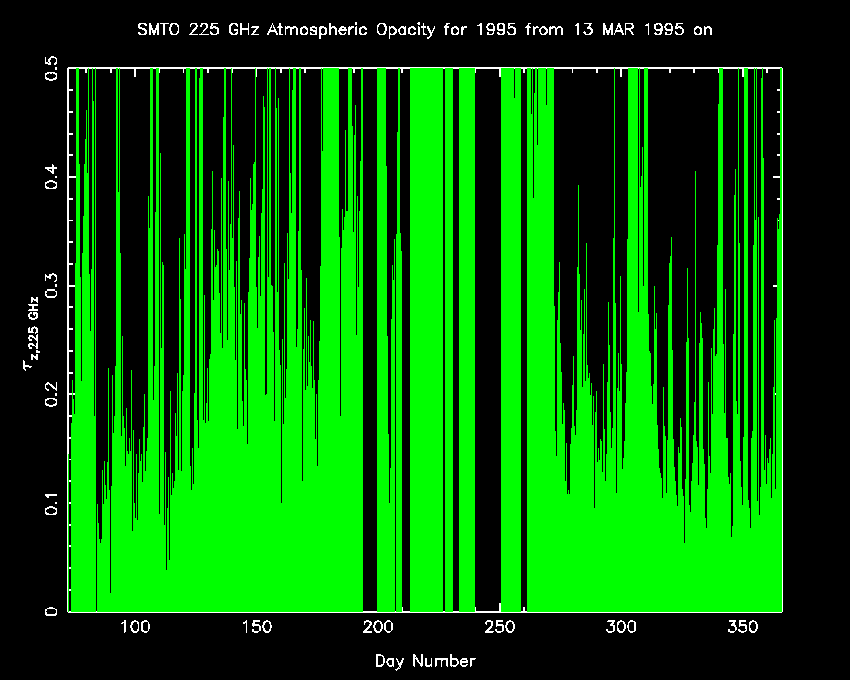
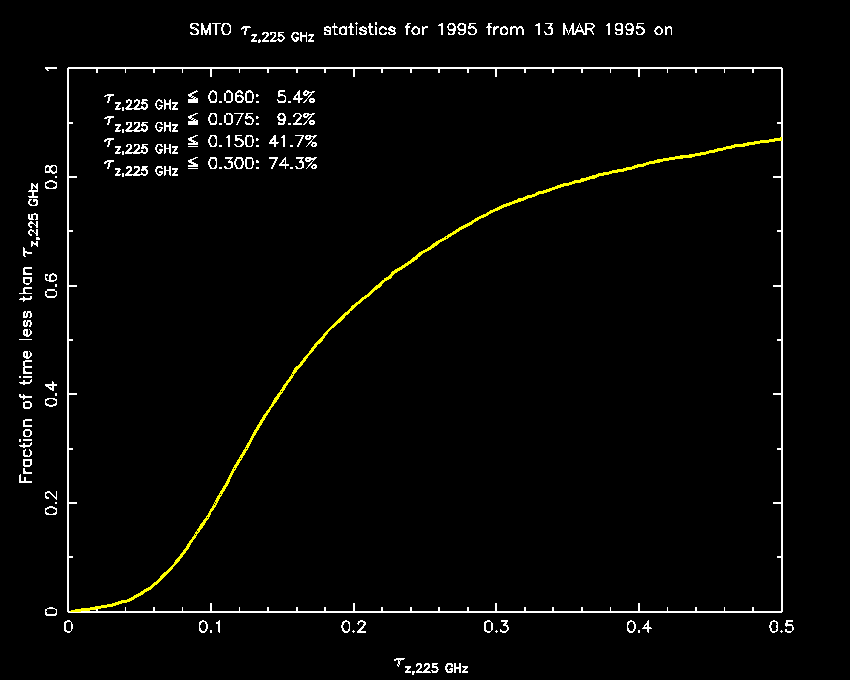
The taumeter data column shows the 225 GHz atmospheric opacity (in nepers) as a function of date. The taumeter stats column depicts the percentage of time that the atmospheric opacity was less than a certain value. This value is attained by time-sampling the raw taumeter data into "bins" of 1/2 hour apiece. An impatient observer, constantly pressing the taumeter acquisition button, will not skew the statistics.
| Year (Click for monthly data) | Taumeter Data (January 1 - December 31) | Taumeter Stats (Jan 1 - Jul 1, Sept 15 - Dec 31) |
| 2004 | GIF / Postscript | GIF / Postscript |
| 2003 | GIF / Postscript | GIF / Postscript |
| 2002 | GIF / Postscript | GIF / Postscript |
| 2001 | GIF / Postscript | GIF / Postscript |
| 2000 | GIF / Postscript | GIF / Postscript |
| 1999 | GIF / Postscript | GIF / Postscript |
| 1998 | GIF / Postscript | GIF / Postscript |
| 1997 | GIF / Postscript | GIF / Postscript |
| 1996 | GIF / Postscript | GIF / Postscript |
| 1995 | GIF / Postscript | GIF / Postscript |
The monthly data show that there is substantial seasonal variation in atmospheric water vapor content. The summer months are generally wet, with substantial July and August monsoon activity. The winter and spring months (November through April) generally bring the best submillimeter observing conditions, with Tau(225 GHz) less than 0.06 typically 10%-30% of the time. Since the telescope can observe 24 hours a day, these months can be used to their fullest advantage.
| Month | Taumeter Data | Taumeter Stats |
| January 2004 | GIF / Postscript | GIF / Postscript |
IMPORTANT NOTICE:
From July 1998 on we present the tipper tau data statistics with a time normalization. Before, just the observed data had been used and gaps had been ignored. There are gaps when the tipper is not in operation (e.g. during a snow storm) but there are also gaps due to bad fits even when the weather is excellent. The new scheme takes both cases into account. The gaps without data are counted as bad weather or high tau. In case of bad fits, a searching algorithm looks for good fits within +/-3 hours from the current slot and uses the corresponding tau value if it finds one. Therefore up- and downscaling is possible.
There are a few months which suffer from extreme downscaling due to extended periods of the tipper being shut down. This usually happens only during the summer months because of maintenance at the telescope site.
All previous data (March 1995 to June 1998) have been rescaled accordingly so that a direct comparison of all plots is possible. In addition to the changes in scaling, we have also improved the graphs by adding more precise date information and percentages for selected tau's. In two cases, (March 7-13 1999 and March 18-19 2000), we included taus that we scaled. They were obtained from spectral line observations during brief periods when our taumeter was offline and we were observing.
 Click here for current
weather conditions at the SMTO.
Click here for current
weather conditions at the SMTO.