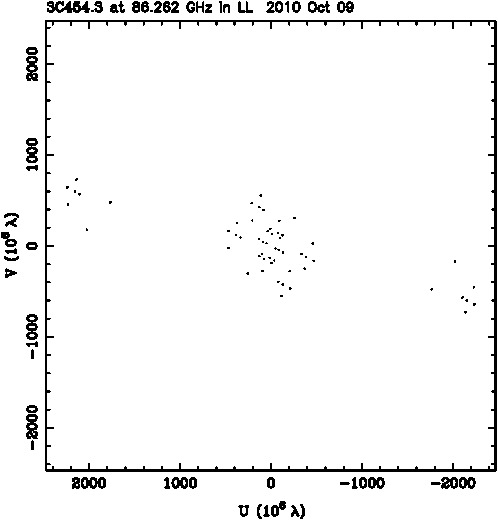
| Observation epoch | 2010-10-01 |
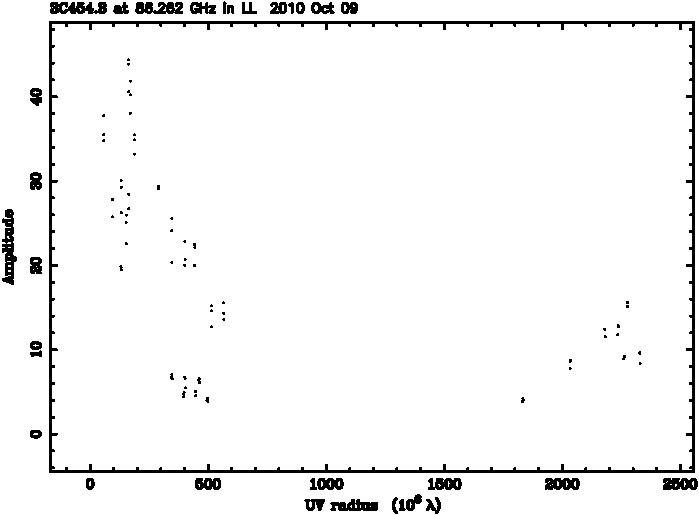
S86 GHzTotal single dish flux density measured at 86 GHz obtained from pointing and calibration scan measurements at Pica Veleta or Plateau de Bure [Jy] | 30.38 |
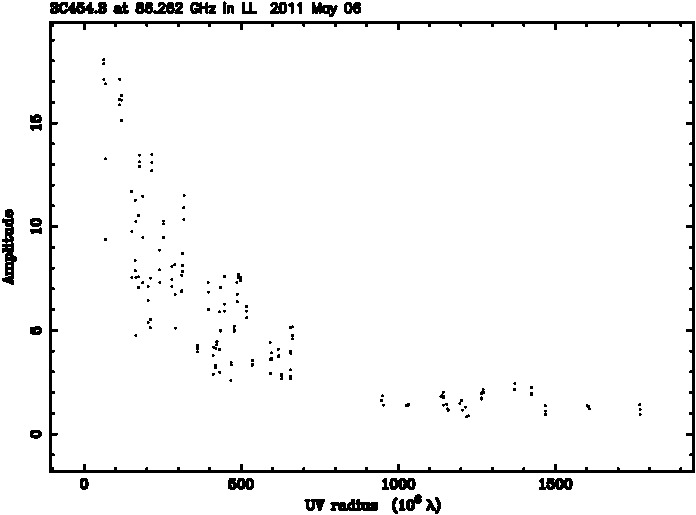
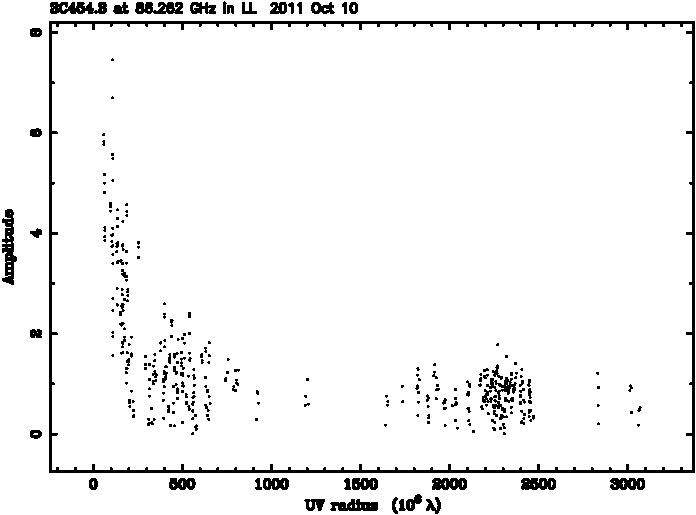
SS [Jy]Correlated flux density [Jy] measured on projected baseline length listed in the next column | 35.567 ± 0.4 |
BS [Mλ]Projected baseline length [Mλ] for the measured flux density listed in the previous column | 58 |
SL [Jy]Correlated flux density [Jy] measured on projected baseline length listed in the next column | 9.27 ± 0.124 |
BS [Mλ]Projected baseline length [Mλ] for the measured flux density listed in the previous column | 2329 |
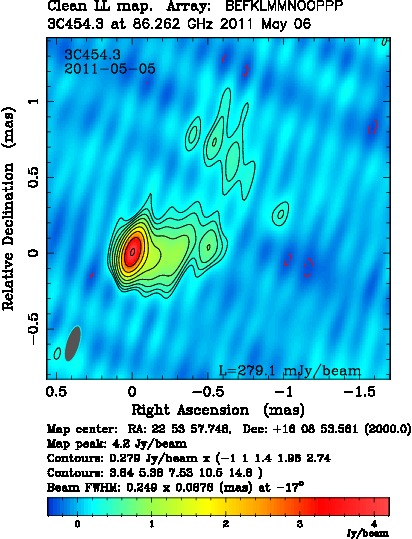
Ba [μas]Major axis of the restoring beam [μas] | 469 |
Bb [μas]Minor axis of the restoring beam [μas] | 72 |
BPA [degrees]Position angle of the major axis [degrees] | -15.7 |
St [mJy]Total clean flux density [mJy] | 21958 |
Sp [mJy/beam]Peak flux density [mJy/beam] | 10166 |
σ [mJy/beam]Off-source r.m.s. noise in the residual image [mJy/beam] | 338 |
ξrQuality factor of the residual noise in the image | 1.1 |