21cm 7 Beam Receiver - Technical Report
The contents of this html file were taken from the pdf version of the Final Report of ESA/ESOC Study Contracts No. 16173/02/D/HK and 17823/03/D/HK.
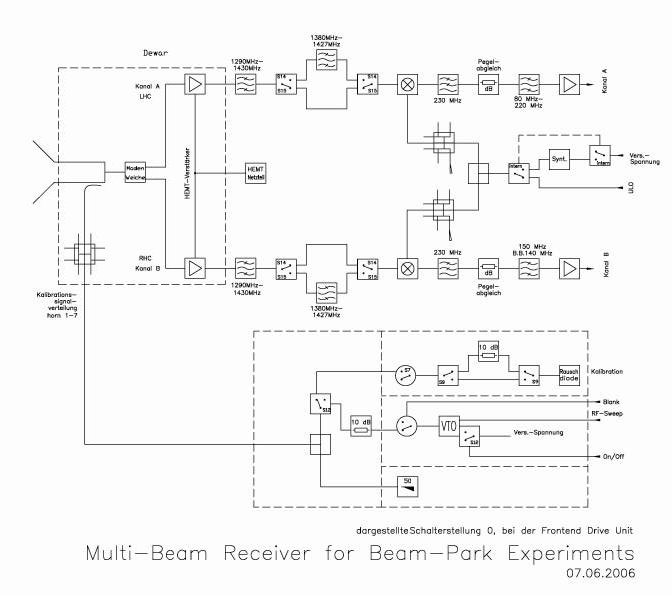
Multi-Beam Receiver for Beam-Park Experiments
and
Data Collection Unit for Beam Park Experiments
with Multi-Beam Receivers
by
Dr. R. Keller, M. Nalbach, K. Müller, U. Teuber, F. Schäfer
Dr. B. Klein, I. Krämer, A. Bell, K. Meyer
Table of Contents
Abstract
On 29./30. June 2006 FGAN/FHR and the Max-Planck-Institut für Radioastronomie (MPIfR) carried out a first high sensitivity space debris observation campaign by means of FGAN’s high power TIRA L-band radar as the transmitter and primary receiver and the new 7-horn 21 cm wavelength receiver described here in the MPIfR 100 m Effelsberg radio telescope as secondary receiver in bi-static beam-park mode. This setup of the two big antennas separated about 20 km line of sight together with the new receiver equipment allows detection of size and trajectory parameters of space debris particles in the cm- and even sub cm-regime up to 1000 km height. This is the final report of the work done in a joint project with ESA/ESOC, FGAN/FHR and MPIfR. It describes the work done for development and construction of a 7-horn L-band receiver and multi channel data collection unit (DCU) under ESA/ESOC contract No. 16173/02/D/HK and 17823/03/D/HK.
purposes. This final design was a cryogenically cooled, high sensitivity and leading edge L-band receiver. It was agreed in the contract, that the receiver will remain at the Effelsberg telescope for space debris measurement experiments as well as for radio astronomy purposes. The receiver comprises seven waveguide feed horns corresponding to seven beams at the sky, one centre beam in the optical axis of the telescope surrounded by six beams with 0,25° offset from the centre and each other. The beams half width is 0.16° in the centre and 0.166° at the outer beams. Due to this receiver beam pattern and its angular resolution properties it is possible to detect size and direction of a particle flying through the beams. Each of the seven horns provides an output for two orthogonal signals: right and left hand circular polarised for the centre horn and two orthogonal linear polarised for each of the outer horns. These 14 signals are then amplified in extreme low noise amplifiers with an equivalent noise temperature of about 5 K. The signals are then further amplified and down converted to an intermediate frequency of 80 MHz to 220 MHz, where they are conditioned for transportation through coaxial cables down the telescope and for being sampled in the data collection unit (DCU).
The DCU was also developed and constructed at the MPIfR in close cooperation with FGAN/FHR. There, at the TIRA, the same sampling hardware is used to provide maximum compatibility between the two facilities. The 14 IF signals are divided into the 32 input channels of eight commercial of the shelf (COTS) data acquisition cards. The IF signals are sampled with a sampling rate of 100 Mb/sec in the fourth Nyquist band from 150 MHz to 200 MHz after careful anti-aliasing filtering. In a special chip the signals are digitally down converted to the base band and band limited to omit further analogue down conversion. In a powerful field programmable array (FPGA) the signals are further reduced and buffered to a data rate suitable for storage through direct memory access on four standard PCI bus systems. The data stream of 32 data channels of a 24 h observation is then stored on eight hard discs of 250 GB capacity each. These discs are then transported to FGAN for further data processing.
1. Introduction
1.1 General
The Max-Planck-Institut für Radioastronomie in Bonn is a research institute of the German Max-Planck-Gesellschaft zur Förderung der Wissenschaften e. V. (MPG), an independent, non-profit organization. Its aim is to carry out basic research in service to the general public in the area of radio astronomy.
A significant portion of the activities of the MPIfR, which was founded in 1966, is based on observations made with the 100 m radio telescope in Bad Münstereifel-Effelsberg. The telescope has been successfully operated since August 1972. With its diameter of 100 m it is still one of the largest fully steer able radio telescopes in the world. The very high surface accuracy enables it to be used down to a shortest wavelength of 3.5 mm. Numerous high-sensitivity and low-noise receiver systems for the frequency range between 400 MHz up to 96 GHz for the 100 m radio telescope have been developed in the laboratories of the institute’s electronic department in Bonn and Effelsberg. More than 30 years of experience in microwave, analogue and digital electronics help the institute to produce cutting-edge receiver and data acquisition equipment.
1.2 Objectives
This is the final report of the work on the joint ESA/ESOC and MPIfR Projects “Multi-Beam Receiver for Beam-Park Experiments” and “Data Collection Unit (DCU) for Beam-Park Experiments” from 1.10.2002 until 31.6.2006. The purpose of this activity was to design and develop a multi-beam receiver at the prime focus of the Effelsberg radio telescope together with a data collection unit located in the backend room at the Effelsberg telescope [2]. This study is based on the experiences of a first bistatic radar experiment for space debris detection in 1996 [1]. In this experiment a single beam receiver as used for radio astronomy purpose was used to detect particles down to sizes of 9mm. The new receiver improves significantly the capability of distinguishing between main lobe and side lobe detections in the bistatic radar experiments with FGAN and Effelsberg operating jointly. The DCU completes the receiving hardware at the Effelsberg telescope; it was developed in strict cooperation with FGAN to provide transparency between internal TIRA standalone operation and joint TIRA-Effelsberg data processing. Therefore the DCU main hardware components (sampling cards, data storage) are identical to those used by FGAN TIRA. Since the MPIfR will use the multi-beam receiver and the DCU for its own purposes other than space debris research, the costs for manpower required for development and production of the system and its infrastructure were borne by MPIfR. The costs for parts purchased and manufactured by external firms were covered by ESA/ESOC. Development costs for parts that are either not commercially available or uneconomical to procure from commercial sources, i.e. the cryogenically cooled low noise HEMT amplifiers, cryocooled waveguide components, the feed horns, infrared rejecting filters and vacuum windows of the receiver as well as the synchronisation and clock unit of the DCU, were also covered by MPIfR.
1.3 Receiver Overview
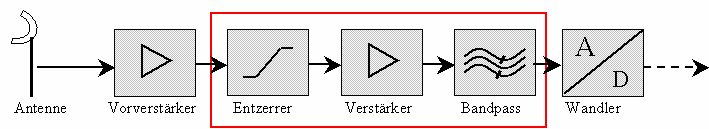
The receiver works as a low-noise 14 channel single conversion heterodyne system [3]. Outputs from a seven element feed horn array couple via circular waveguides into a cryogenic Dewar. Fourteen low-noise preamplifiers (one for each polarization) provide an initial 40 dB of gain across a 1200 MHz to 1700 MHz band with an excess noise contribution of about 5 K. The arrangement of the seven feeds follows a hexagonal structure with one feed on the telescope axis and six feeds surrounding the centre feed. The layout of the seven coaxial feed elements in the array is determined by the need for highest possible beam efficiency while simultaneously arranging the beams to minimize inter-beam coupling and spacing. The 14 preamplifier outputs are passed through the Dewar walls via a hermetic coaxial connector bulkhead, whereupon further amplification and filtering outside the Dewar limits the received band to 1290 MHz to 1430 MHz. These signals are then fed to a 14 channel down conversion system that is amplifying, filtering and mixing the incoming signals to an intermediate frequency band covering the frequency range 80 MHz to 220 MHz. The receiver thus far is housed in the telescope primary focus cabin, from where 14 separate IF-channels are passed to the receiver control room via low loss coaxial cables of more than 300m length. Cable-equalization filters and amplifiers correct the cable pass bands distortion.
The cryogenic front end is situated right at the focal plane area of the telescope primary focus. The complete front end is integrated in an MPIfR standard receiver box. It consists of the feed horn array, the cryogenics Dewar containing cooled waveguide filters, cooled orthomode transducers and HEMT preamplifiers. Behind the Dewar are the ambient-temperature amplifier-filter modules, the IF processors, the calibration unit and an electronics module containing support electronics, HEMT amplifier bias supplies and a comprehensive monitoring system. The monitoring system indicates the bias states of all transistors in the 14 cooled preamplifiers and LO Power as well as temperature and vacuum information on the cryogenic system performance. A Sumitomo SHI RDK-415D cold head provides the cryogenic cooling of this system. The total capacity of this cold head is 20 W on the 15 K-platform and about 80 W on the 70 K-platform.
1.4 Data Collection Unit Oveview
The DCU collects the data of bistatic beam park experiments from the L-band multi-beam receiver at the Effelsberg radio telescope [4]. It provides 14 analogue input channels which are sampled at IF frequency in the range of 150 – 200 MHz. The sampling rate of the analogue to digital converters (ADC) is 100 MHz with 14-bit resolution at each channel. This provides much more than the 2 MHz bandwidth needed for BPE and does digital down conversion by means of under sampling. Additional digital down converters (DDC) provide flexible base band conversion and filtering of the sampled IF signals simultaneously at all 14 channels. One powerful field-programmable gate array (FPGA) for every two inputs enables digital signal processing for base band processing needed for BPE. The collected data is buffered on the ADC modules to provide real time data flow to the following processors.
All 14 input channels are sampled synchronously to maintain coherence between the measured data of all seven beams. Therefore a stable reference clock oscillator feeds simultaneously all ADC modules with accuracy according to radio astronomy standard via a special synchronisation module. An absolute time signal (time reference) at the beginning of the experiment is provided with the sampled data.
The following chapters describe the work done in the projects divided into the work packages as defined in the contracts.
2. Multi-Beam Receiver for Beam-Park Experiments; Description of the Work Packages:
2.1 WP2000 Design of the Multy-Beam Receiver
2.1.1 WP2100 Detailed Concept Design:
A detailed block diagram including all RF-levels of the receiver is shown in the appendix. Due to the low RF frequency a single frequency conversion scheme was chosen. A switchable filter in each receiver channel was inserted to allow the RF bandwidth been restricted for different observation modes and to avoid interference if needed. Appendix 1 shows the detailed block diagram of the receiver.
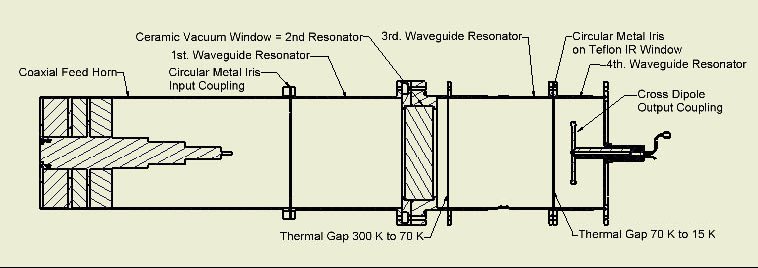
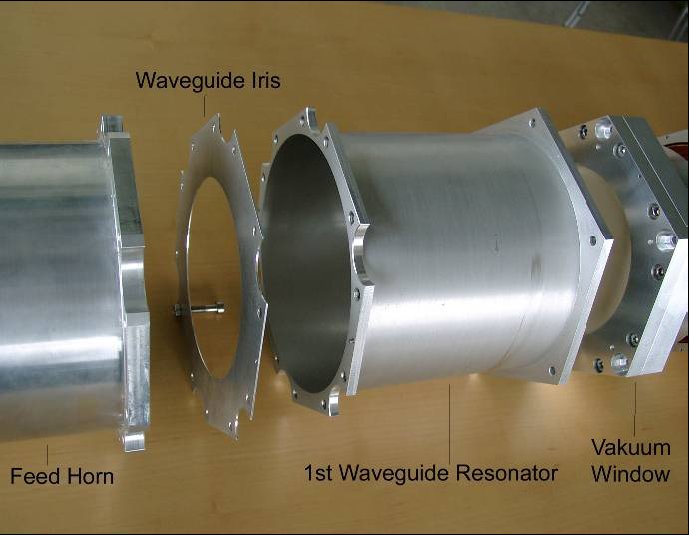
To reduce nonlinear effects due to strong interference in the first amplifier stages filtering before these amplifiers were considered. HTSC filters were investigated for this purpose and two HTSC filters were available for tests. Due to the extremely high Q of the HTSC-Filter the out of (filter-) band impedance presented to the low noise amplifier is a nearly ideal short. This gives rise to strong oscillations of the amplifier which are very difficult to control within the design procedure of the amplifier. An additional isolator in front of the amplifier solves the problem, but this is naturally at the expense of higher front-end noise temperatures due to the added losses. Therefore conventional filtering in conjunction with a sophisticated ceramic vacuum window was chosen to suppress interference. The concept of this combined vacuum window – filter structure is shown in figure 1; an exploded view of the realized structure is shown in figure 2.
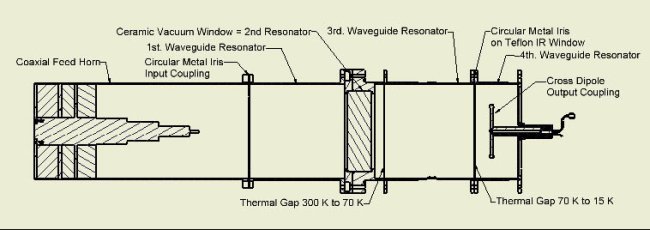
Figure 1: mechanical outline of the waveguide front-end


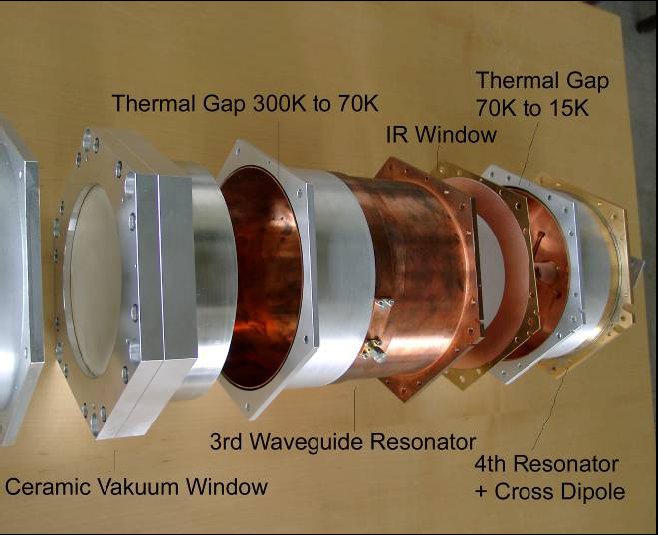
Figure 2: Waveguide Filter Front-end of Outer Horns; Exploded View.
2.1.2 WP2200 Cryogenic Design:
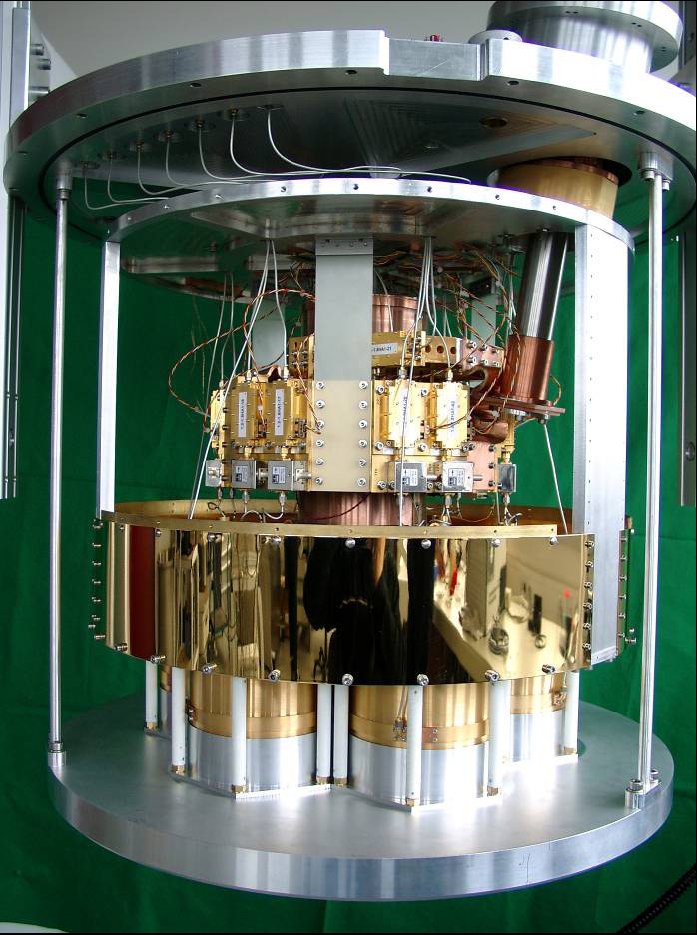
The thermal concept of the Dewar has been developed and realized (figure 3). Special ceramic vacuum windows have been designed to obtain excellent leakage rate while providing minimum insertion loss. To match these windows a sophisticated waveguide filter structure was designed which includes the infrared filter at 70K temperature level (see figures 1, 2). Part of the IR-filter has a metallic surface so the thermal conductivity is significantly better. This helps to maintain low temperature on the 15K cooling stage. With the ceramic vacuum windows we got a low leakage rate and a very low cryogenic temperature of less than 10 K together with excellent electrical performance. Figure 3 shows the insight of the realized cryostat with all components built in. Only the 70 K shielding is partially missing.
The only available cooling machine with appropriate cooling power is the Sumitomo SHI RDK-415D refrigerator system. To test its power under real conditions a test in the Effelsberg telescope was made by using the given infrastructure. See WP4200 for more details.
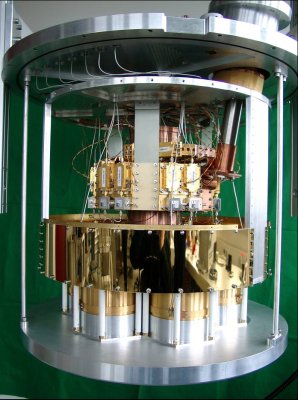
Figure 3: Dewar insight.
|
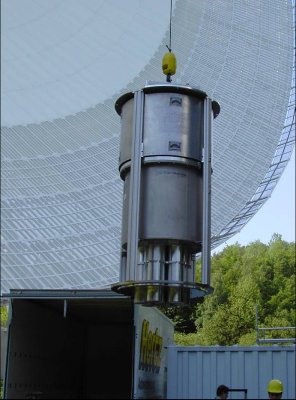
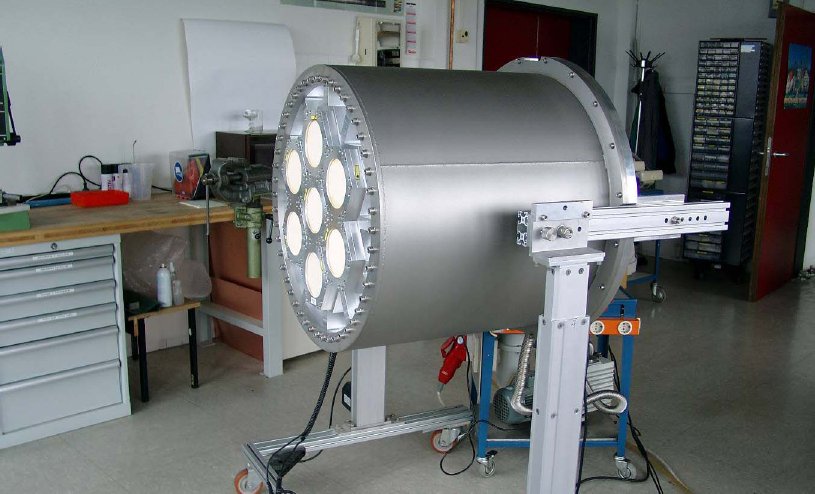
Figure 4: Mechanical outline
|
2.1.3 WP2300 Mechanical Design:
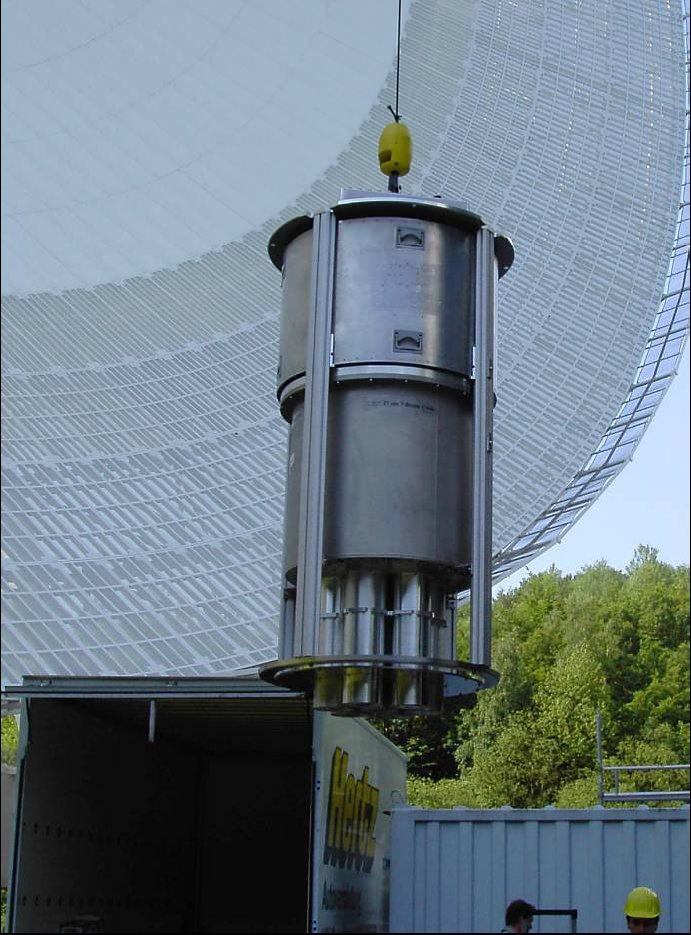
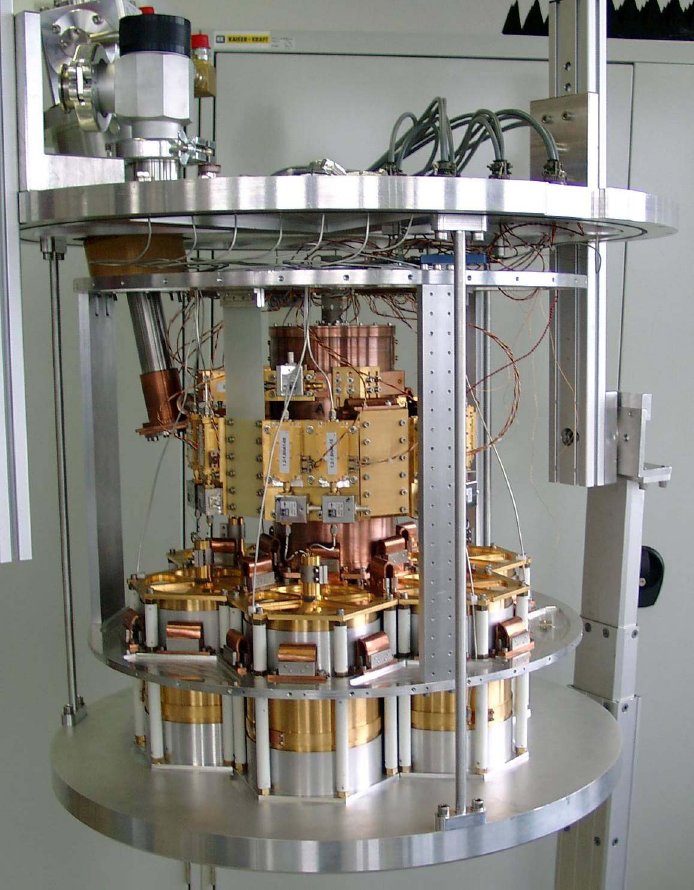
A compact and lightweight receiver box had to be designed to fit into the geometry given by the telescope. Our standard boxes could not be used for that purpose due to the very tight package of the seven beam receiver. Furthermore a significant weight reduction had to be achieved. Therefore a sophisticated construction had to be designed to meet the boundary conditions in the telescope. Figure 4 shows the complete receiver box on the way into the Effelsberg telescope.
2.1.4 WP2400 Construction of a single beam receiver:
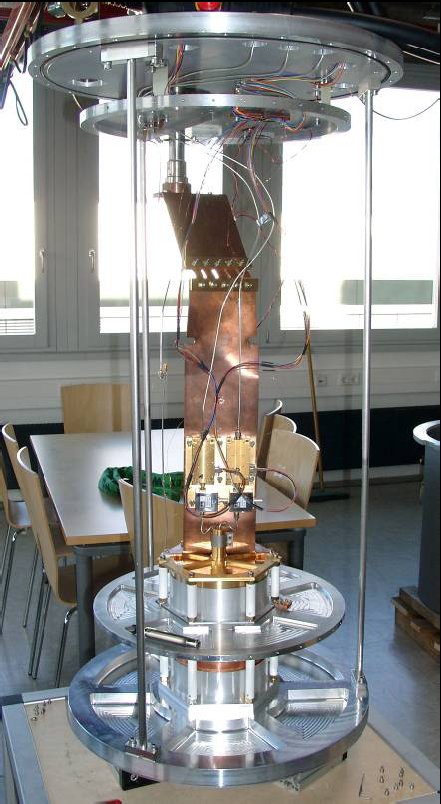
In the minutes of the kick-off meeting a single beam receiver was specified as a test vehicle for the various new developed mechanical and cryogenic principles and waveguide front ends. In figure 5 one of the outer six waveguide front-ends of the multi-beam receiver is shown integrated in the Dewar of this test receiver. Electrical performance and cooling properties have been tested successfully before integration in the final Dewar. The centre waveguide front-end was also investigated. Leakage rate and cooling characteristics of the Dewar are good. The Dewar is now equipped with a spare front-end of the cross-dipole type. It was used for an experiment together with FGAN were TIRA was transmitting and we received and detected the signals in our lab in Bonn to verify the principle of transmit pulse detection in the DCU.
The single beam receiver as defined in WP2400 is now working in the lab in Bonn. As this receiver is not used for BPE measurements it will be modified after finishing the project for radio astronomy purpose. In the future this receiver will be included in one of the new three frequency boxes in the Effelsberg telescope.
|

Figure 5: test receiver Dewar.
|
2.2 WP3000 Development and Realization
2.2.1 WP3100 Waveguide components design and construction:
A lot of investigations were made on various kinds of components for the waveguide front-end. The following results will give an overview of the most important key elements:
General investigations were made to find an appropriate vacuum window for the big waveguide openings. In our designs we normally use thin foil windows. They provide low gas permeability but are mechanically very sensitive. Therefore we looked for more robust massive materials (Appendix 8.2, table 2). Due to high dielectric constants of the materials together with restricted place in the Dewar these windows are poorly matched to the waveguide. One Solution was suggested by DESY for rectangular waveguides with a Wesgo Al 995 ceramic. Together we made investigations with this material for circular waveguides and chose it for the multi beam receiver in a very special filter structure (see figure 1 and 2).
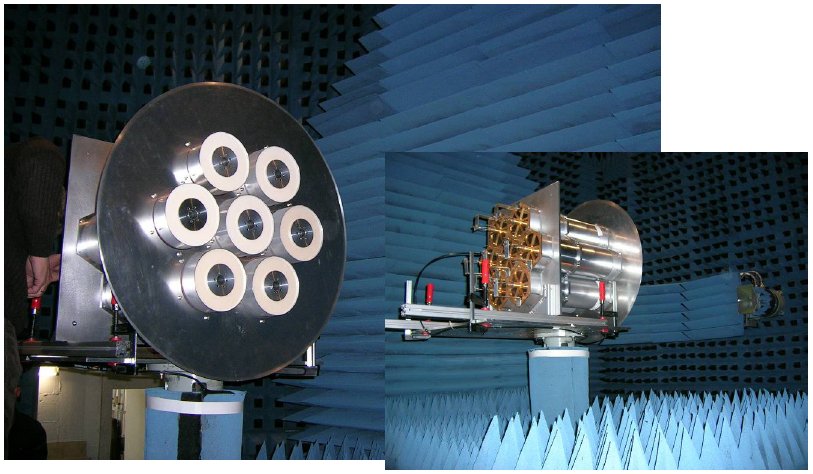
A horn test assembly to measure the coupling between horns and the antenna patterns of the array was built up. These measurements were needed by FGAN to match the analysis software to the receiver. Measurements were carried out in one of the antenna test ranges at FGAN (Figure 6) and showed very good results concerning cross coupling between the horns (Appendix 8.3) and antenna patterns of the horns (Figure 7).
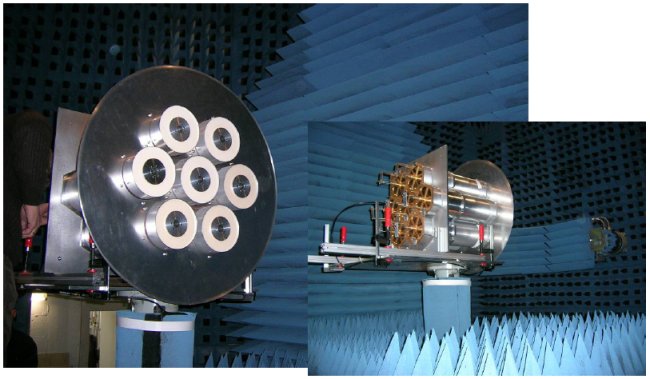
Figure 6: Horn Test Assembly measured at FGAN.
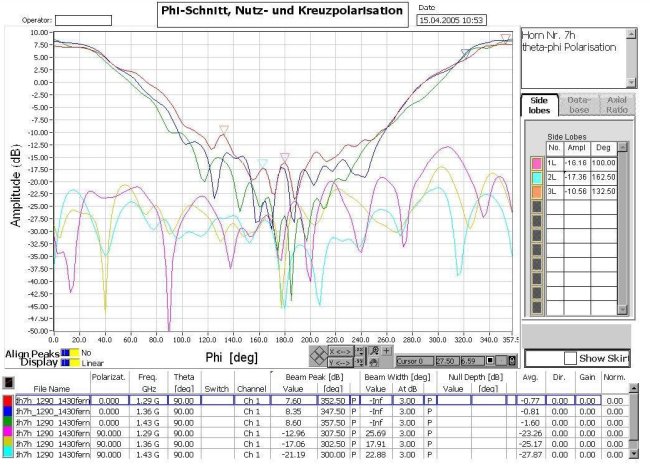
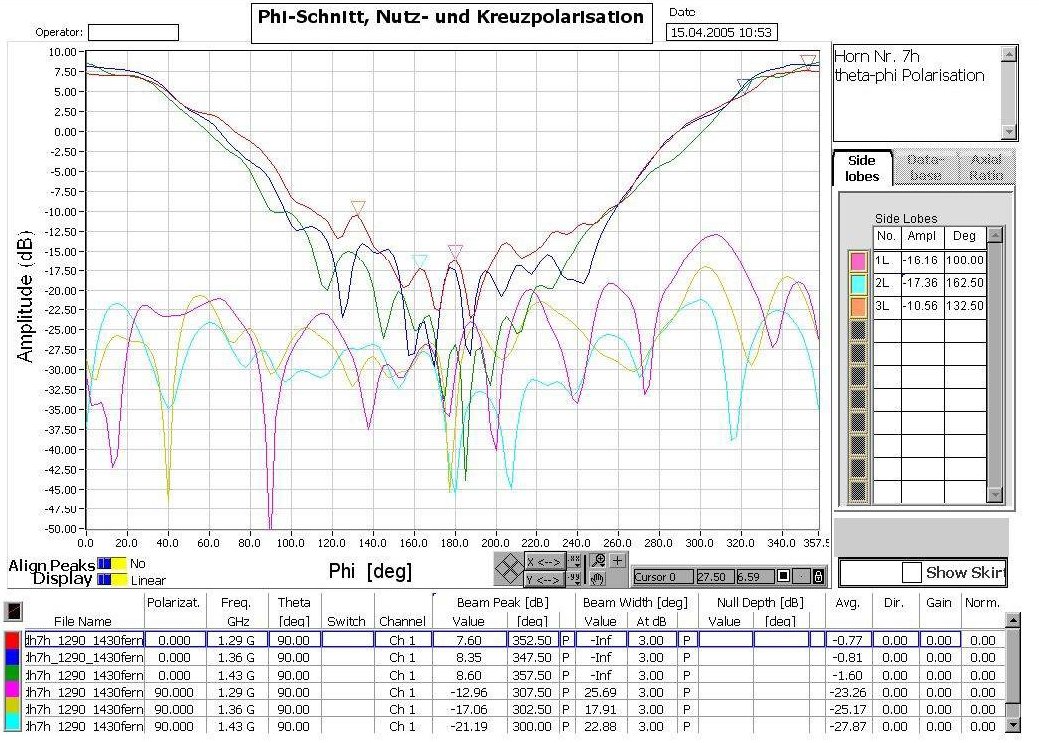
Figure 7: Coaxial Waveguide Horns: Measured Performance of Centre Horn, Vertical Polarisation.
Figure 7 shows the measured antenna pattern of the centre horn, table 3 (Appendix 8.3) indicates the measured cross couplings between the horns and cross polarisation measured through the coaxial ports. The results meet the specification.
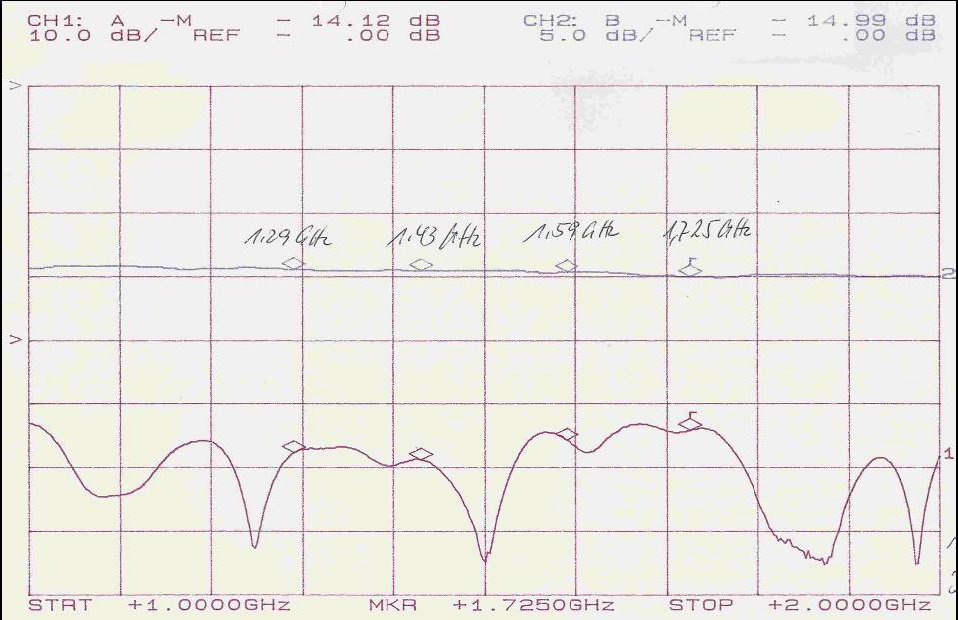
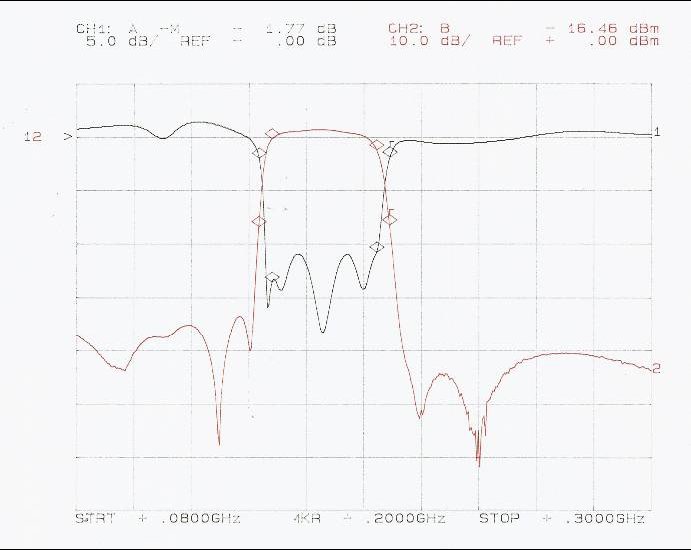
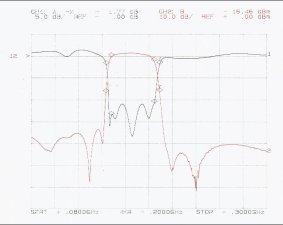
The input filter assemblies to match the ceramic windows were simulated carefully and tuned for perfect electrical matching in the desired frequency range. Figure 8 shows the measured scattering parameters of the complete waveguide assembly including feed horn, ceramic window, matching network and dipole type OMT. Return loss S11 is measured including the feed horn with very good performance. The insertion loss S21 is measured without feed horn (figure 9) but including the dipole OMT and shows a promising value of about 0.3 dB over the whole band.
Waveguide Filter Structure Outer Horns
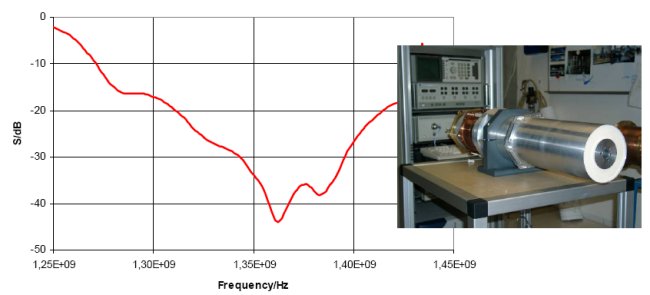
Figure 8: Waveguide Filter Structure: Measured Performance.
Fwaveguide filter frontend with cross-dipole cooled/uncooled
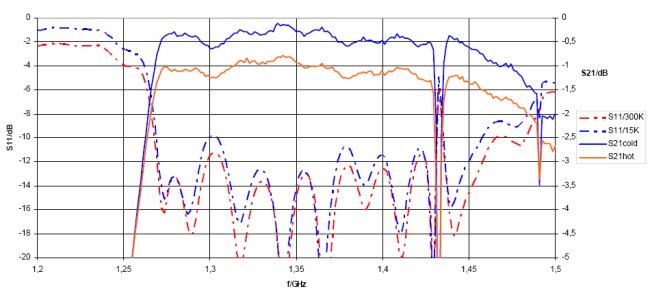
Figure 9: Measurements of one of the outer front-ends at 15 K and 300 K.
2.2.2 WP3200 High Temperature Super-Conducting (HTSC) Components:
Substrates for HTSC components are available and tests have been made to process the surface at MPIfR. The gold plating for connecting HTSC components to the environment turned out to be very critical. A first design for ultra low insertion loss hybrids is available.
One option in the offer to this project was insertion of HTSC filters to avoid out-of-band interference. Due to the new waveguide filter structure formed by vacuum window, infrared window and waveguide iris described in WP3100, no HTSC filters are used in the receiver.
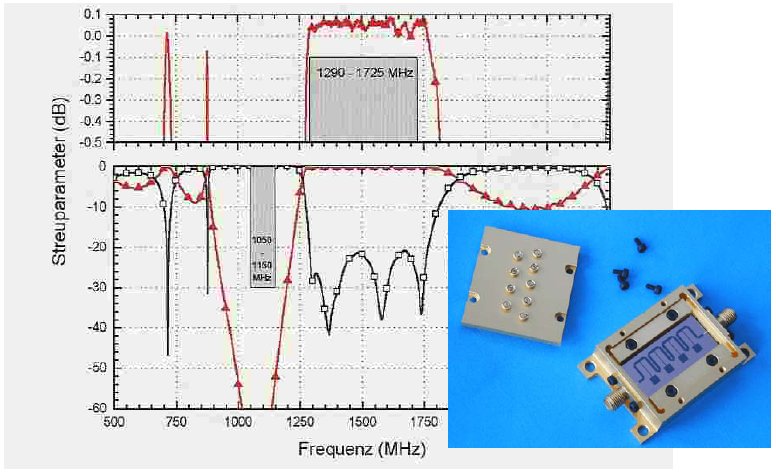
For testing the principals in the single beam prototype receiver two externally fabricated HTSC filters were available (Fig. 10). They had been developed and realized by the University of Wuppertal, Prof. Chalupka, and Dr.-Ing. Reppel et al (see also Reference [6]).
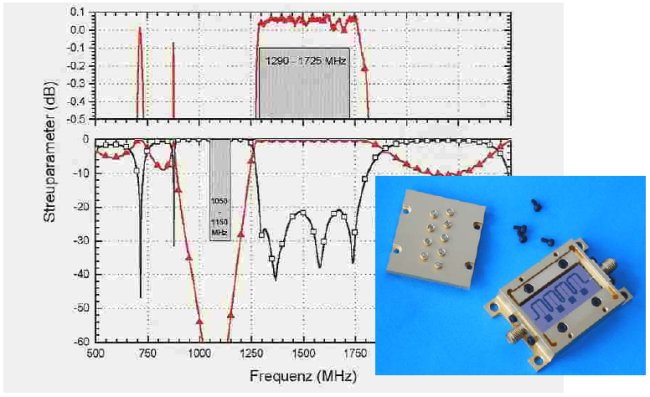
Fig. 10: HTSC Filters: measured scattering parameters at 20K
2.2.3 WP3300 Low noise amplifiers development and realisation:
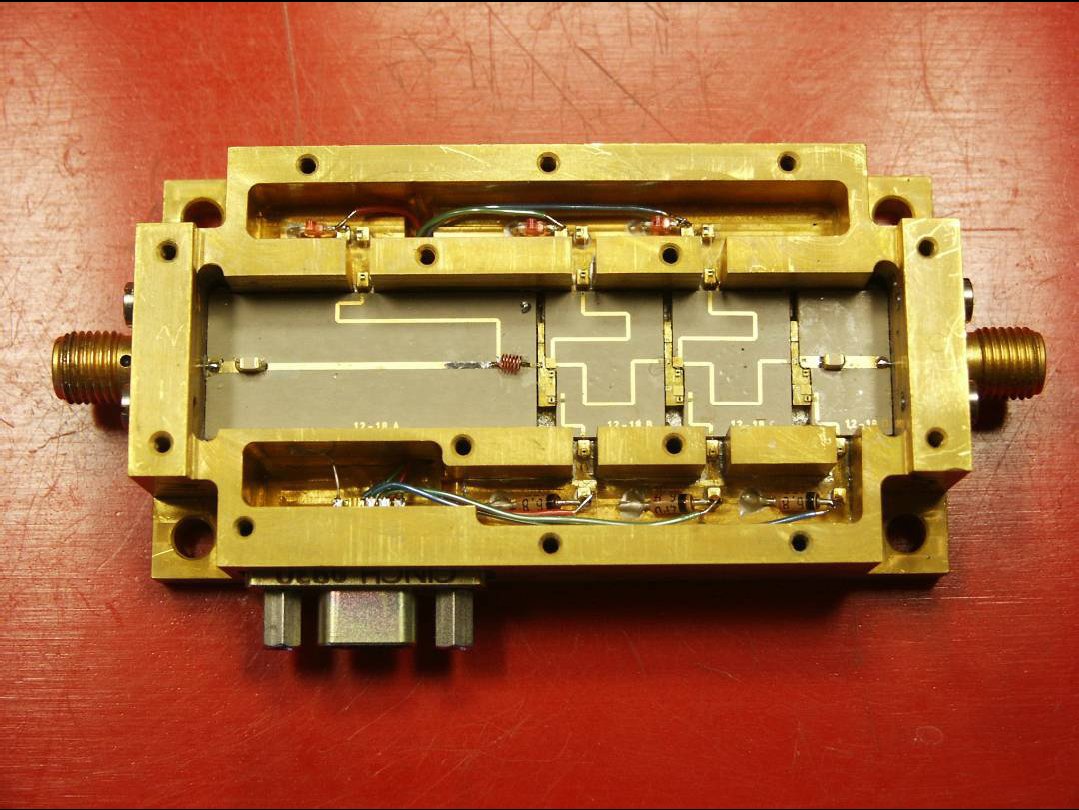
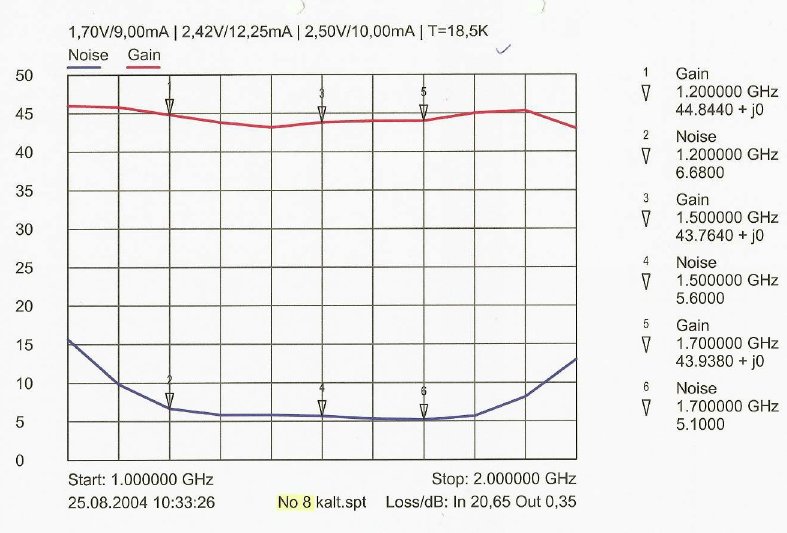
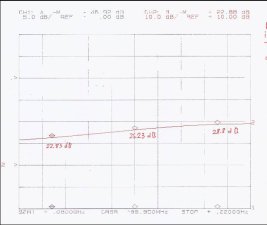
25 HEMT type low noise amplifiers have been realised. Fig. 11 shows a photography of one of the amplifiers opened. Figure 12 shows the electrical performance of one typical amplifier at cryogenic temperatures (15K). The design is a classical microstrip design on a Duroid 6010 10 mil thick substrate. The active devices are Mitsubishi MGFC 4453 HEMT chips wire bonded into the matching networks. The noise figure is between 4K and 6K, depending on the amplifier, the gain is better than 40 dB. These amplifiers are integrated in the seven beam receiver and will be used in the single beam receiver.
To supply the amplifiers with DC a new, fail save power supply unit was developed (Figure 13). To avoid damage due to unspecified conditions during on and off switching of the unit the gate voltage is always delayed with respect to the drain voltage.
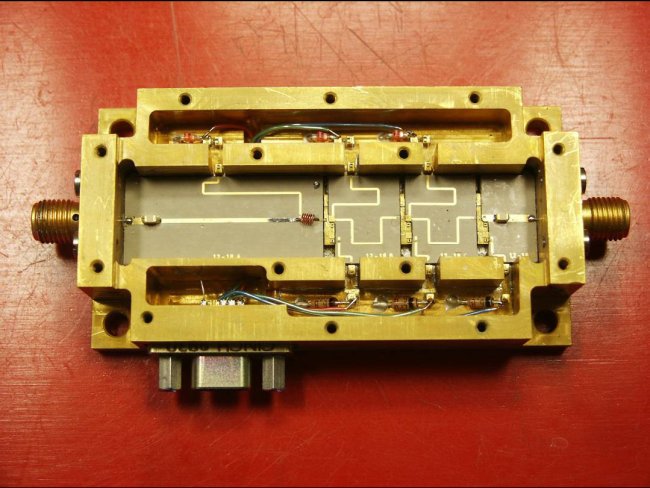
Fig. 11: HEMT amplifiers for 1 to 2 GHz, Picture with cover removed.
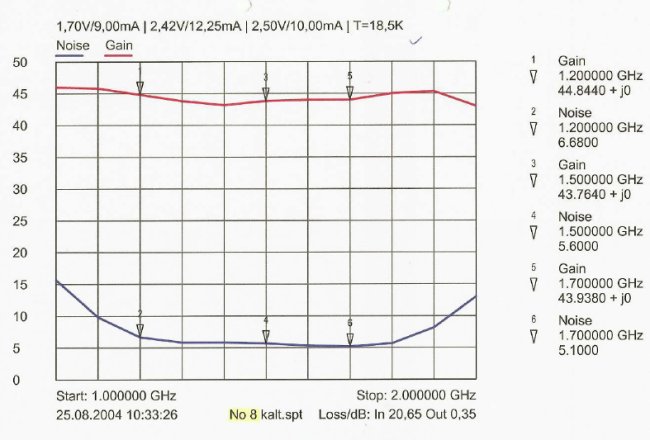
Fig. 12: HEMT amplifiers for 1 to 2 GHz, measured gain and noise temperatures for a typical sample (No. 8).
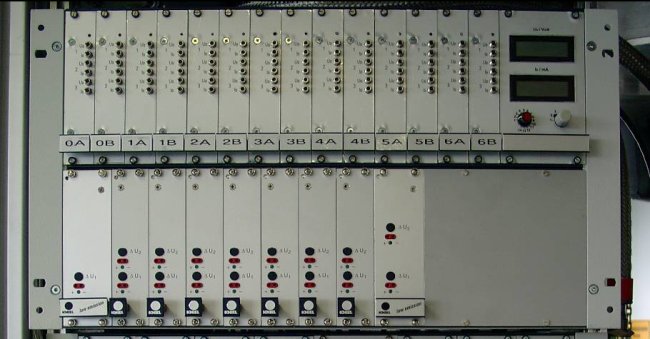
Fig. 13: DC Power supply for the 14 HEMT amplifiers
2.2.4 WP3400 Dewar design and construction:
The Dewar for the seven beam receiver was designed at the MPIfR and constructed and produced at CRYOVAC, a company specialized on these types of components. The Dewar was delivered as a complete system with all connections and vacuum windows built in with a leakage rate specified and vacuum tested.
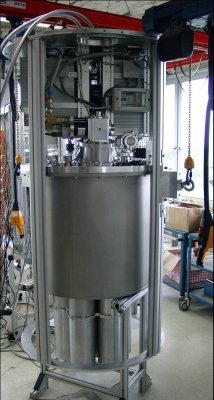
Figure 14 shows the Dewar in its handling device. On the left side the seven ceramic vacuum windows can be seen. The total weight of the Dewar including windows and refrigerator is 180 kg, as it was projected.

Figure 14: Final Multi-Beam Receiver Dewar
2.2.5 WP3500 Intermediate Frequency (IF) and Local Oscillator (LO) processing units:
2.2.5.1 IF processing unit:
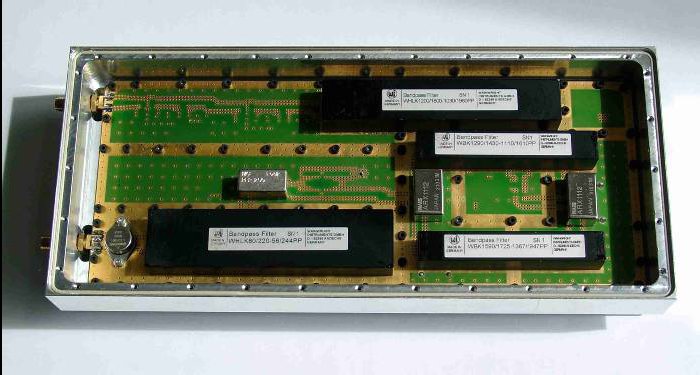
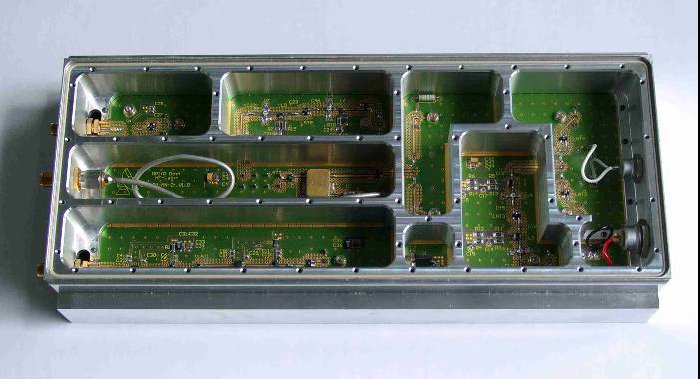
The printed circuit board of the integrated IF units was developed by using coplanar waveguides (CPW) for the signal path. This had to be done to avoid any mutual coupling between the various IF stages. A housing for that board is developed in parallel to provide perfect isolation between the various stages. Figure 15 shows one of 14 units with the top and bottom cover removed.
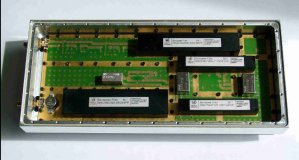
Figure 15: IF processing unit: Bottom View
|
Top View.
|
The Printed Circuit Boards (PCB) is designed as a 6 layer multi layer board. Figure 16 shows the composition of the board. Two different dielectric materials were chosen. The top layer is a low loss material for microwave applications to carry the signal path. The inner layers are standard PCB material for DC supply. The bottom layer was chosen to be the same material as the top layer to maintain symmetry in the board structure.
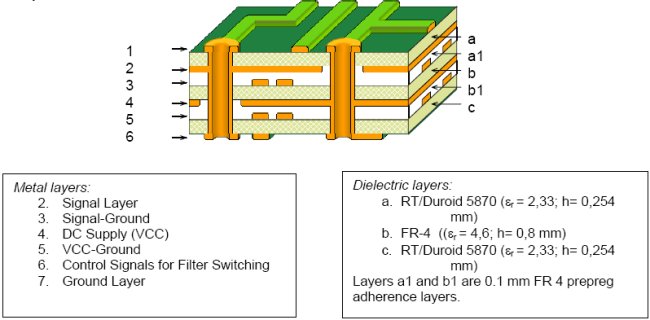
Figure 16: IF processing unit: PCB composition.
Figure 17 shows the measured gain stability of all IF units in terms of the Allan variance. Figure 18 shows the measured band pass characteristics of all units integrated in the receiver.
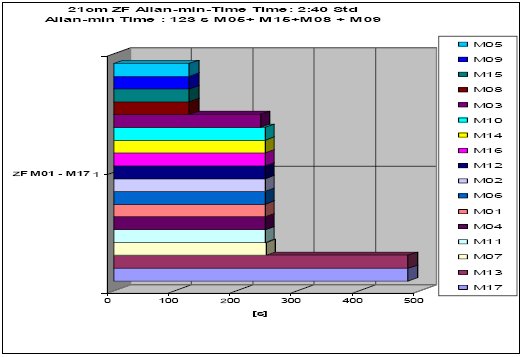
Figure 17: IF processing unit: Stability measurements comparison.
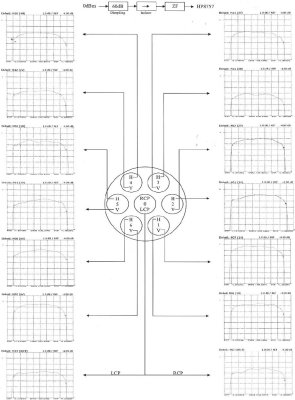
Figure 18: IF processing unit: Band pass Characteristics.
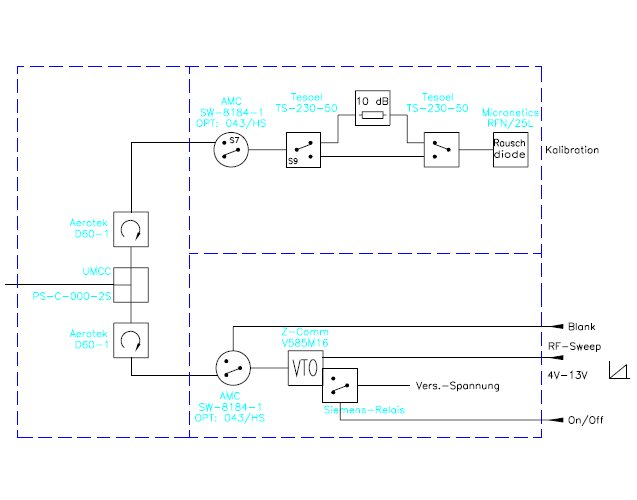
2.2.5.2 Calibration Unit
The calibration unit to calibrate the seven beam receiver for radio astronomy measurements was realized in classical coaxial technique. Figure 19 shows the overall behaviour of the unit. In this scattering parameter measurement plot the signal input port is the output of the calibration diode; the signal output is the port going into the 1 to 8 power divider to feed the seven calibration couplers. Figure 20 shows the block diagram and a photograph of the assembled unit.
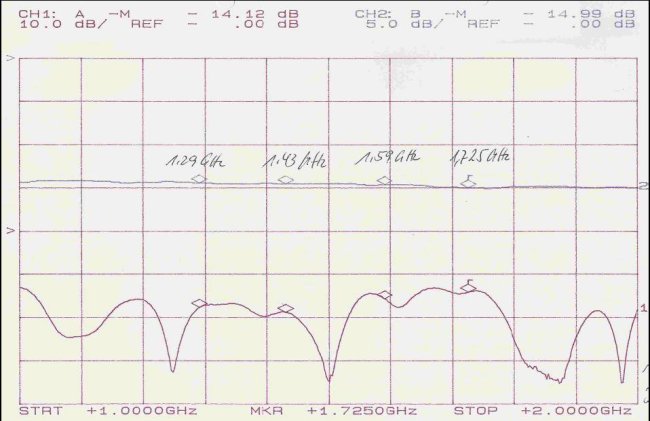
Figure 19: Calibration unit: Overall Performance S11 and S21.
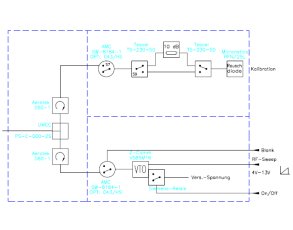
Figure 20: Calibration unit: Block Diagram and Photography.
|
|
2.2.5.3 Local Oscillator (LO) Distribution
LO distribution mainly consists of a passive power divider and equal length coaxial cables. Amplification is only needed for the optional local oscillator built in. A phase switching and adjusting unit for astronomical purpose is under development. This does not influence the BPE project time table, as it is not needed for BPE. Figure 21 shows a photography of the IF unit including the LO distribution.
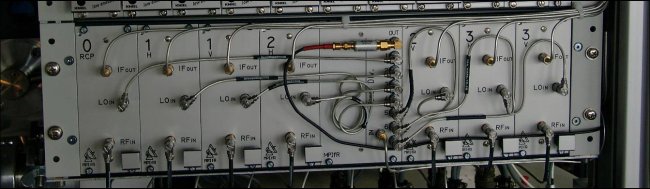
Figure 21: IF unit with LO distribution.
2.2.6 WP3600 System Integration
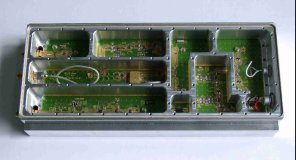
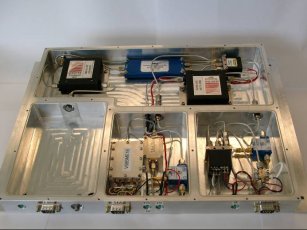
All receiver function blocks were integrated into the receiver box. First all post processing units, IF calibration and LO distribution, have been integrated, finally the Dewar including waveguide front-ends and low noise amplifiers was inserted. Figure 22 shows a photograph of the final receiver box with side walls opened. The various building blocks as described before can be seen. On the lower right side the IF units with LO distribution in the middle can be seen, above them the general DC unit is placed (partially filled with power supply units). On the left side temperature regulation (green detail) and helium supply for the refrigerator is shown.
On the opposite side 7 more IF units plus LO distribution are placed, above them the HEMT-DC supply. This unit was developed with special safety features on a basis of our previously used supplies to avoid damage on the numerous low noise amplifiers.
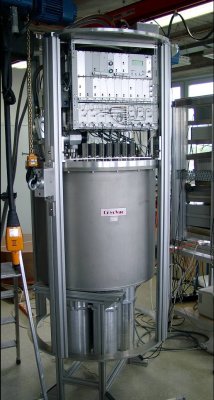
Figure 22: Receiver: IF right side
|
cryo cooler side.
|
After the Dewar’s leakage rate was verified the integration of all waveguide components and amplifiers started. Figure 23 shows the fully integrated Dewar (without 70 K shield). After closing the Dewar was integrated in the box as shown in figure 22, lower part, with the horn arrangement pointing to the ground.
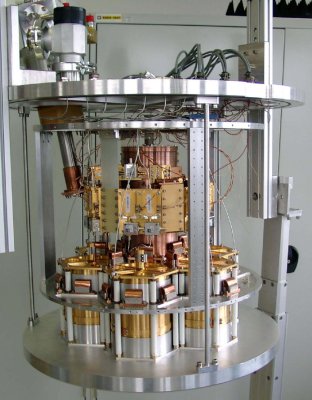
Figure 23: 7-Beam Dewar fully equipped.
2.3 WP4000 Extension of Infrastructure
As there was never before a multi-beam receiver in the primary focus of the Effelsberg telescope some infrastructure had to be endorsed or at least investigated.
2.3.1 WP4100 Additional Cabling in Effelsberg
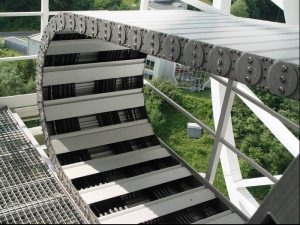
To get access to all 14 channels of the multi-beam receiver new IF cables were installed in the telescope. Cable channels and conduits were installed to carry 16 new IF cables. 14 cables are needed for signal transport and two are spare channels. All of the more than 300 m long cables from the telescopes primary focus to the control room can be used up to a frequency of 300 MHz. Additional optical fibres for receiver control are also installed. Figure 24 shows one part of the new cable tray and the new flexible cable conduit at the elevation axis.
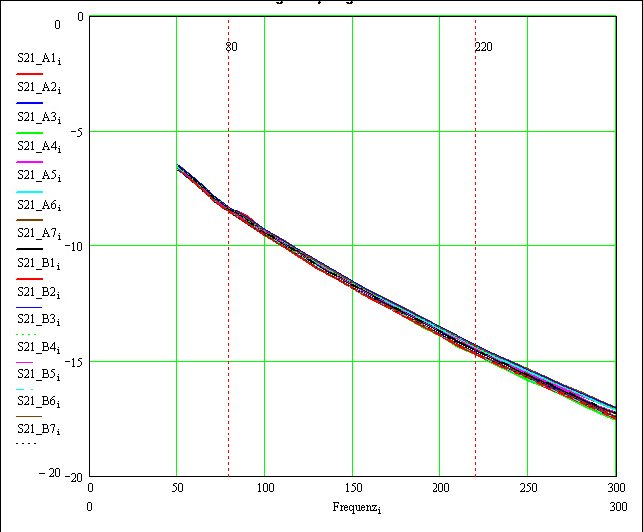
Figure 25 shows the measured insertion loss of all 14 used IF cables from the primary focus cabin to the faraday room where the DCU is located. The total attenuation as well as the attenuation slope is compensated with the equalizer unit described later in this report. The cables show a good performance with very similar frequency response, so no individual tuning of the equalizer units was needed.
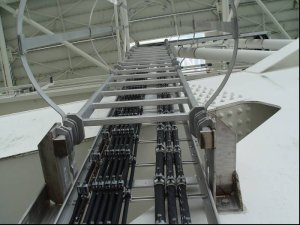
Figure 24: IF cables in their cable trays.
|
|

Figure 25: Insertion loss measurement of all 14 IF cables in the telescope.
2.3.2 WP4200 Additional Helium Support
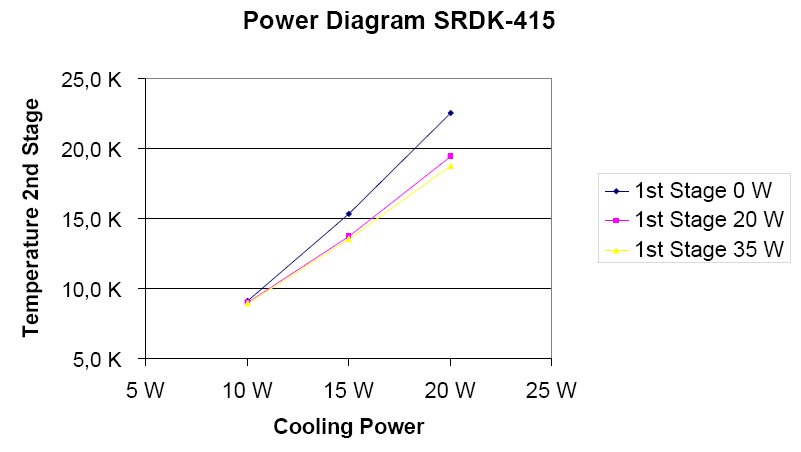
In May 2003 a test of the chosen cryogenic cooling equipment was organized in cooperation with Sumitomo Company, the manufacturer of the refrigerator. The final helium setup was used as foreseen with the Multi-Beam receiver. The cooling power was measured and was accepted for the Multi-Beam receiver. Figure 26 shows the measured cooling power on the 2nd cooling stage with different loads on the 1st stage. After completion of the seven beam receiver it turned out, that this refrigerator was the right choice as we achieved a perfect cryogenic temperature at the front-end of less than 10 K.
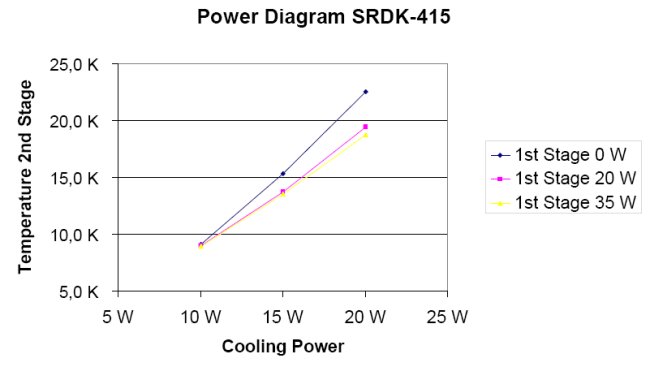
Figure 26: Measured Cooling Power at 15K under working conditions in the telescope.
2.3.3 WP4300 Multi-Beam Receiver control unit
It turned out, that the Multi-Beam Receiver can be controlled with one of our new standard receiver control units. Therefore no special control unit needed to be built.
2.3.4 WP4400 Backend Distribution
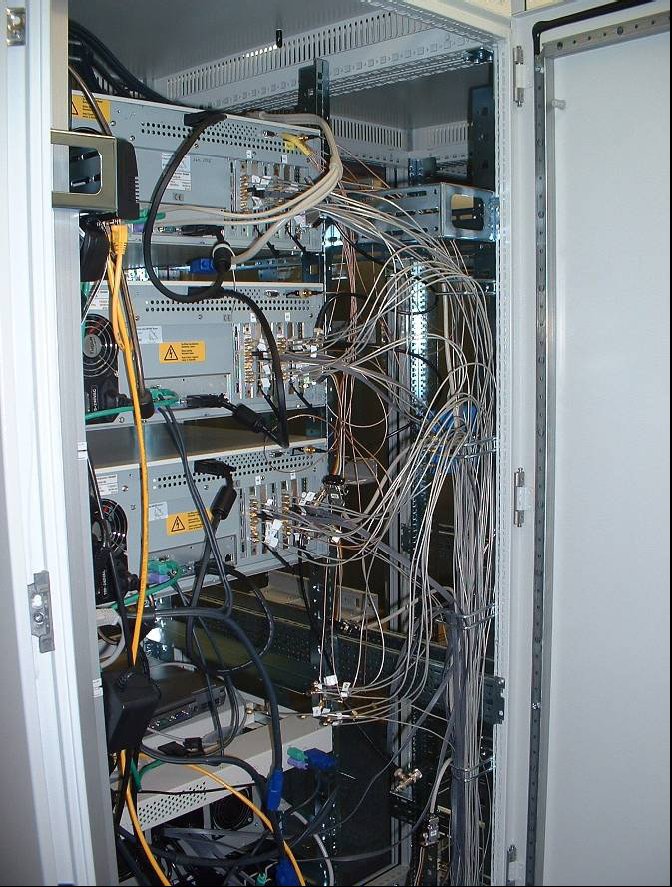
A backend distribution module has been developed which conditions the signals from the receiver for the DCU. Figure 27 shows the simplified block diagram of the unit and figure 28 shows a photography of the assembled units. All PCBs are assembled and the tuning of filters and equalisers has begun. The first CNC milled 19” final enclosure is also shown in the figure. 14 of these units were integrated in the DCU rack.
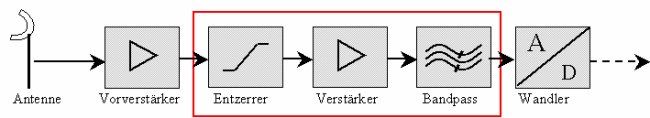
Figure 27: Backend Distribution Block Diagram.
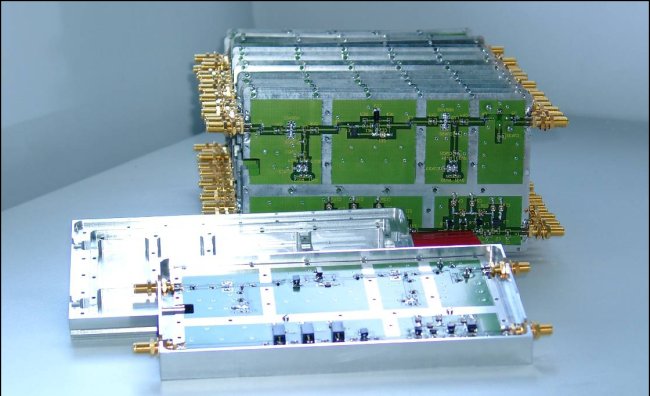
Figure 28: Backend Distribution Unit: Boards and housing.
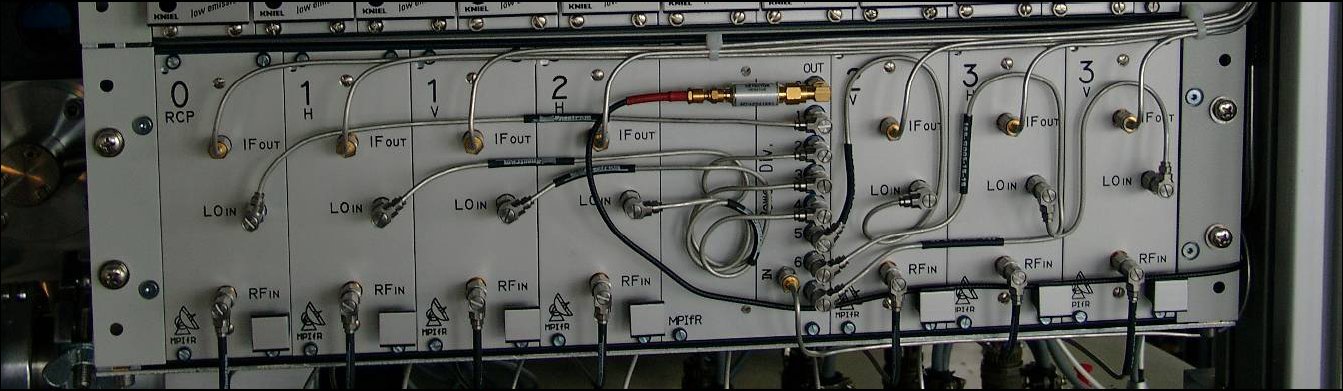
All cable equalizer modules were tuned individually and tested. They were integrated in the DCU rack (Figure 29). Performance of one typical channel is shown in figure 30.
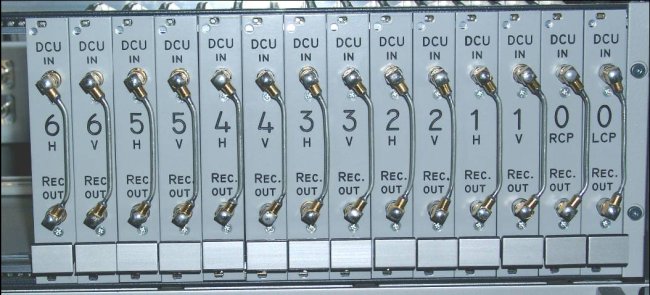
Figure 29: Backend Distribution Unit: Picture of the integrated 14 cable equalizer units.
|
|
| Figure 30: Backend Distribution Unit: Performance of typical cable equalizer unit #2. |
2.4 WP5000 Testing of the Multi-Beam Receiver
The aim of this work package was to test the system and characterize it. In the following the main parameters of the receiver system are given.
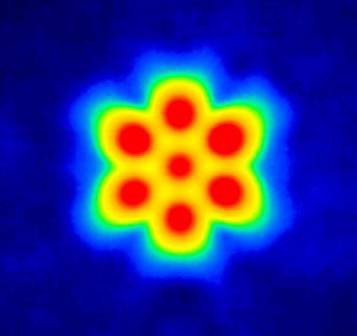
The beam pattern of the receiver system in the telescope was carefully measured with radio astronomy sources. As the standard Effelsberg infrastructure supports only four input channels, any of the six measurements comprised two beams. Each of the outer beams was characterized together with the centre beam to get comparable measurements. The beam pattern is shown in figure 31; a table with the numerical values of the beam pattern measurement is also available. It was sent to FGAN for data processing.

Figure 31: Measured beam pattern of the Effelsberg telescope equipped with the multi beam receiver.
There are two frequency ranges by different RF filters which can be selected remotely from the control rack:
| 1290 MHz bis 1430 MHz GHz (S14, S15 = 0) |
| 1380 MHz bis 1427 MHz GHz (S14, S15 = 1). |
For Space Debris measurement the broadband option (S14, S15 = 0) must be used. The first local oscillator frequency (fULO1) is given by the IF frequency. In the case of BPE the DCU is used with an IF centre frequency of 175 MHz: fULO1 = fsky – 175 MHz that means fULO1 = 1158 MHz. The second ULO (Universal Local Oscillator) frequency of the Effelsberg system is not used.
Total bandwidth of the receiver is 140 MHz per channel, which is reduced to 45 MHz in the equalizer unit at a centre frequency of 175 MHz suited for the DCU.
The measured noise figure of the different channels is shown in table 1. With these parameters the receiver meets the expected specifications for Beam Park Experiments. Therefore the receiver was used together with the Data Collection Unit for a first successful BPE on 29/39 June 2006. Particles down to 11mm could be detected. Thus the multi-beam receiver is ready to be used in future BPE.
| Channel | Polarisation at sky | Receiver Noise Temperatures |
|---|
| | | TReceiver/K | Tcal I /K | Tcal II/K |
|---|
| 0A | LHC | 20,9 | 4,5 | 0,5 |
| 0B | RHC | 20,5 | 5,5 | 0,6 |
| 1A | V | 13,9 | 4,0 | 0,4 |
| 1B | H | 10,9 | 4,1 | 0,4 |
| 2A | V | 16,8 | 4,8 | 0,5 |
| 2B | H | 9,9 | 4,7 | 0,5 |
| 3A | V | 20,6 | 4,2 | 0,4 |
| 3B | H | 14,2 | 4,0 | 0,4 |
| 4A | V | 17,6 | 3,9 | 0,4 |
| 4B | H | 13,5 | 4,0 | 0,4 |
| 5A | V | 19,3 | 3,6 | 0,4 |
| 4B | H | 14,3 | 4,0 | 0,4 |
| 5A | V | 11,4 | 4,4 | 0,4 |
| 4B | H | 14,1 | 5,1 | 0,5 |
Table 1 Measured Noise Figure of the 14 receiver channels.
3 Data Collection Unit for Beam-Park Experiments with Multi-Beam Receiver; Description of the Work Packages:
3.1 WP2000 Development of a Dual-Channel Prototype DCU
To check the principles of the DCU hardware, first a dual-channel prototype DCU was developed to evaluate the ADC behaviour in terms of accuracy and excess noise and the processing performance of the FPGA. Because the off-line data analysis requires high-precision timing information of the sampled data, a detailed concept of the DCU time stamping has been worked out: To provide a data record with an absolute time stamp, an IRIG-B decoder has been implemented in the FPGA. The accuracy of the single samples between two absolute time stamps is supported by ADC synchronisation to the reference frequency system of the observatory. To limit the amount of data, which must be record to disk, a flexible transmit pulse detector has been implemented in the FPGA, which gates the data flow to the storage system. A block diagram of one of seven identical data acquisition boards is shown in Figure 32.
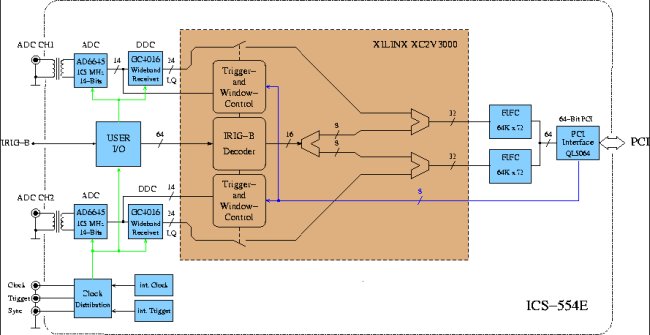
Figure 32: Block Diagram of Prototype DCU Hardware
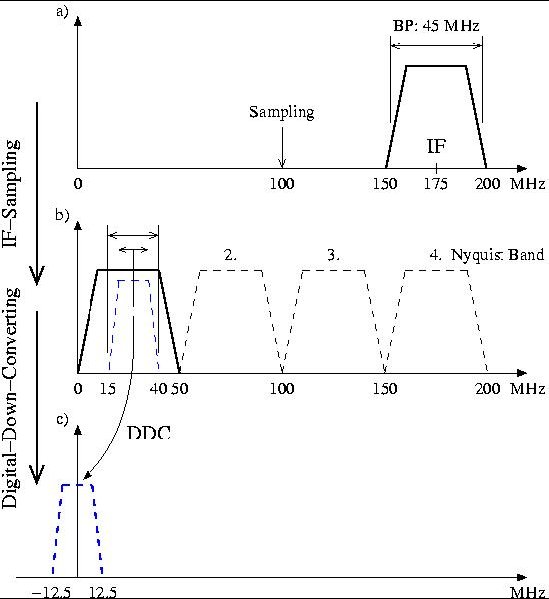
The incoming data were sampled by a 14-bit ADC at 100 MHz in the 4th Nyquist band (150-200 MHz) using a suitable band-pass filter. This is done by undersampling techniques to avoid the common used base-band mixing by analogue components (see Figure 33).
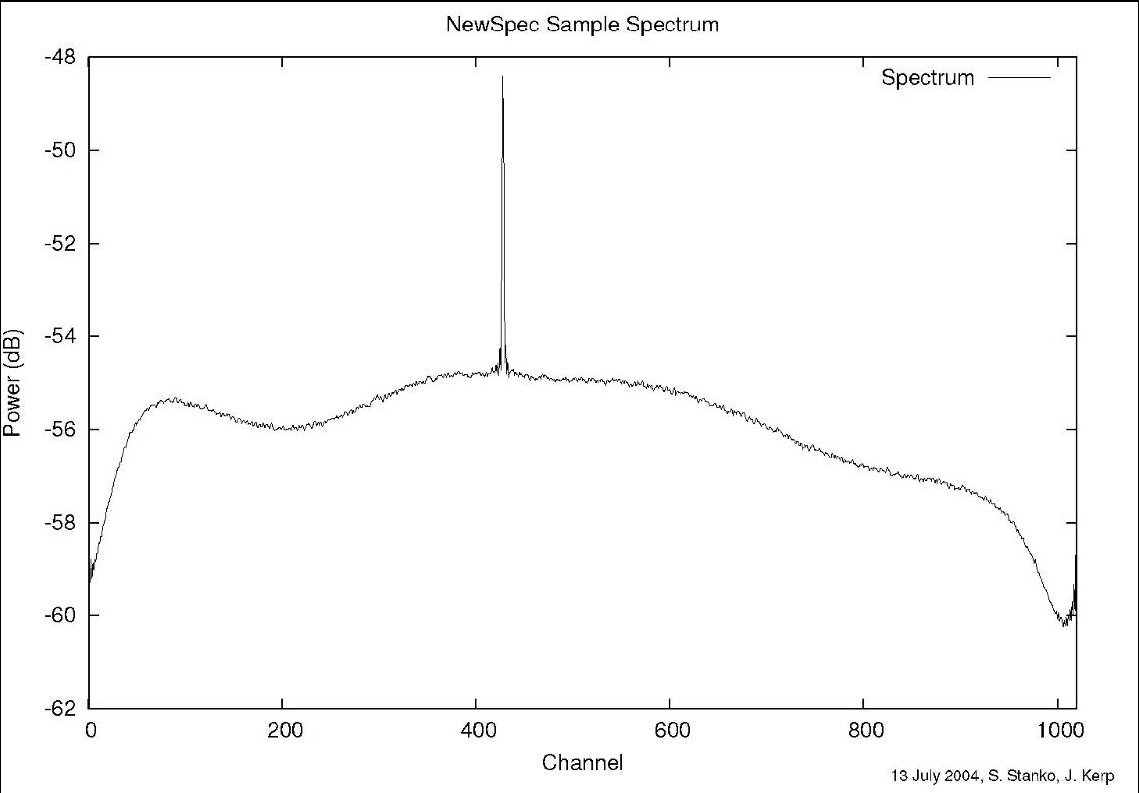
After theoretical considerations, a DCU prototype has been assembled and taken into operation (see Figure 34). Function tests have been made and were very promising. Particularly, the important time stamping of the sampled data was working well. System parameters such as frequencies and bandwidths as well as power levels have been designed and tested. First results of the dual channel prototype DCU are shown in Figures 35 and 36. In Fig. 35 a typical power spectrum of 50 MHz bandwidth with an inserted frequency line around 20 MHz is shown.

| Figure 33: | DCU frequency diagram: To avoid an additional analogue base-band mixing, the band limited IF (150 - 200 MHz) is undersampled in the 4th Nyquist band by a 100 MHz ADC. Using on-board DDCs, the band of interest can be digitally selected in terms of bandwidth and centre frequency. |
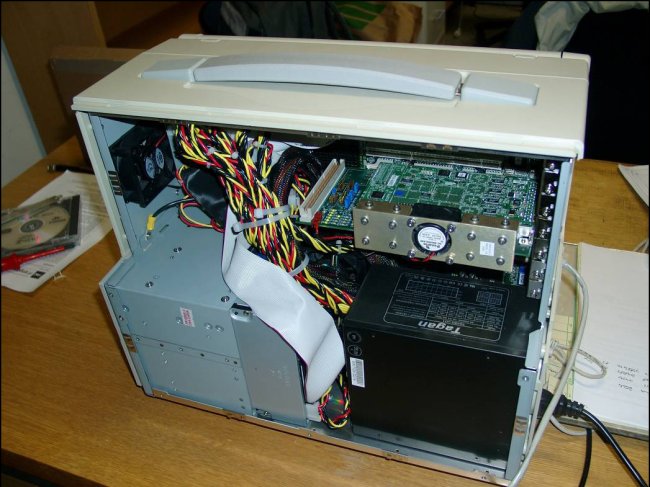
Figure 34: Photo of the Prototype DCU Hardware
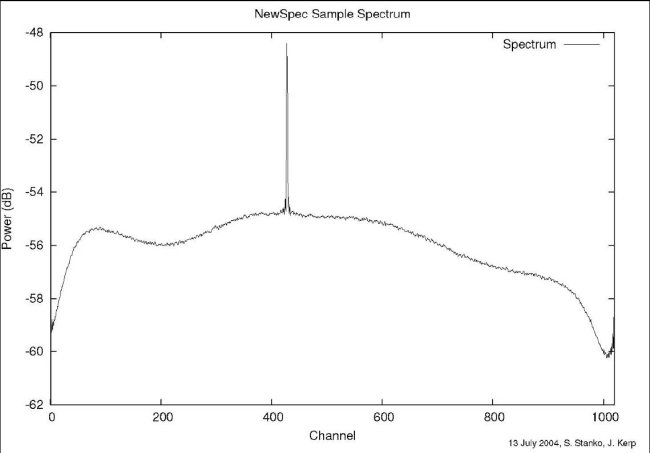
Figure 35: Test Result: 50 MHz Power Density Spectrum with an inserted frequency line
Figure 36 illustrates the stability represented by the Allan Variance. With an Allan stability time of more than 1000 second, the system performance of the DCU is many times better compared to astronomical receivers. As the required stability for BPE experiments is less critical than for radio astronomy purpose, the obtained results are very promising and fulfil all expected specification.
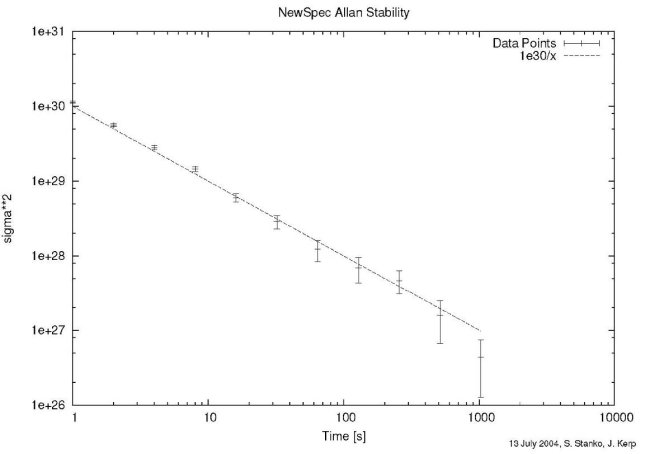
Figure 36: Test Result: Allan-Plot of DCU stability
3.2 WP3000 Hardware Integration of 14 Channel DCU
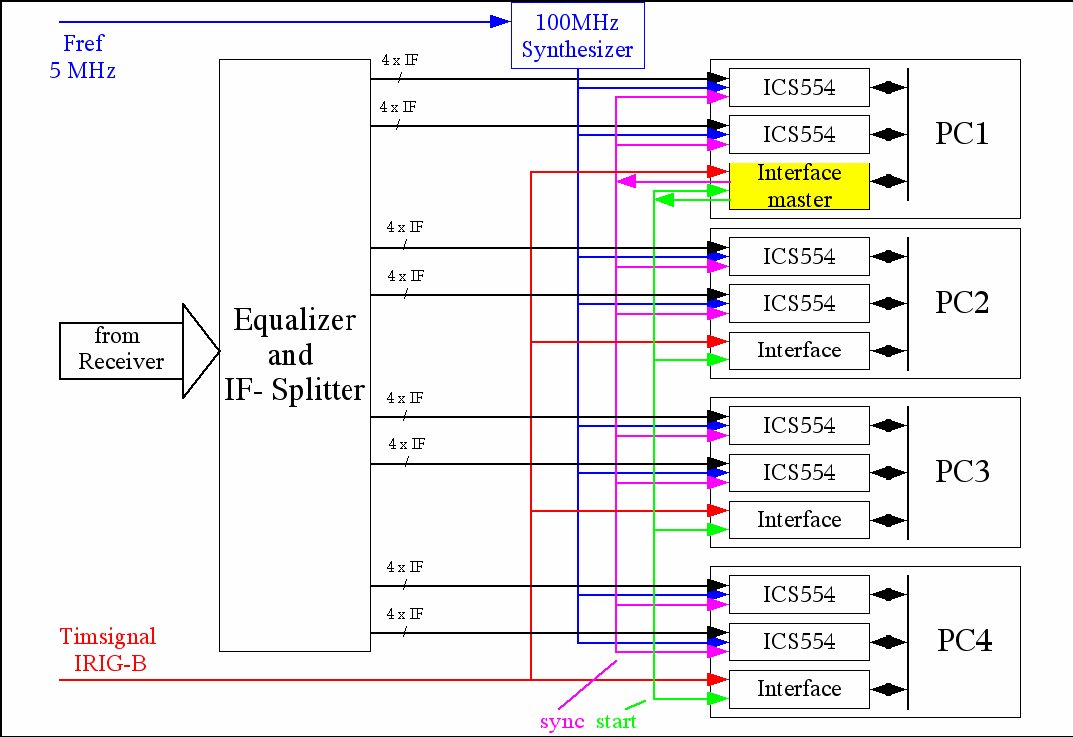
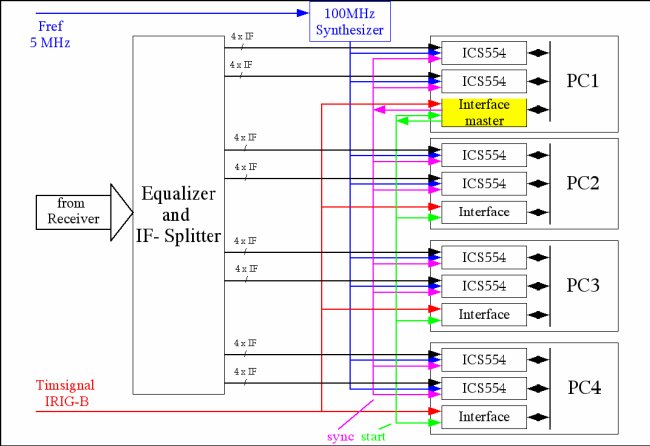
The final 14 channel DCU was built as a sevenfold copy of the dual-channel prototype DCU. Figure 37 illustrates the distribution of the ADC/FPGA boards to the four PCs. Notice the redundancy in the connections between the receiver and the acquisition boards. Every input channel is wired on two different cards on different PCs and the centre channels are wired on four sample cards to get optimum redundancy.
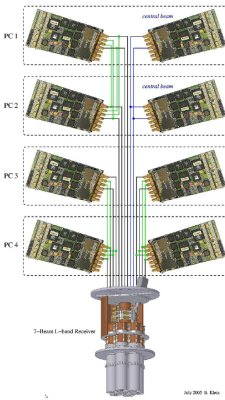
| Figure 37: | DDCU concept: The picture illustrates the distribution of the 8 data acquisition boards to four PCs and there connections to the 7-beam receiver. The redundancy connections are drawn in blue (central beam) and green (outer beams). |
3.2.1 WP3100 Purchase of Hardware for Prototype:
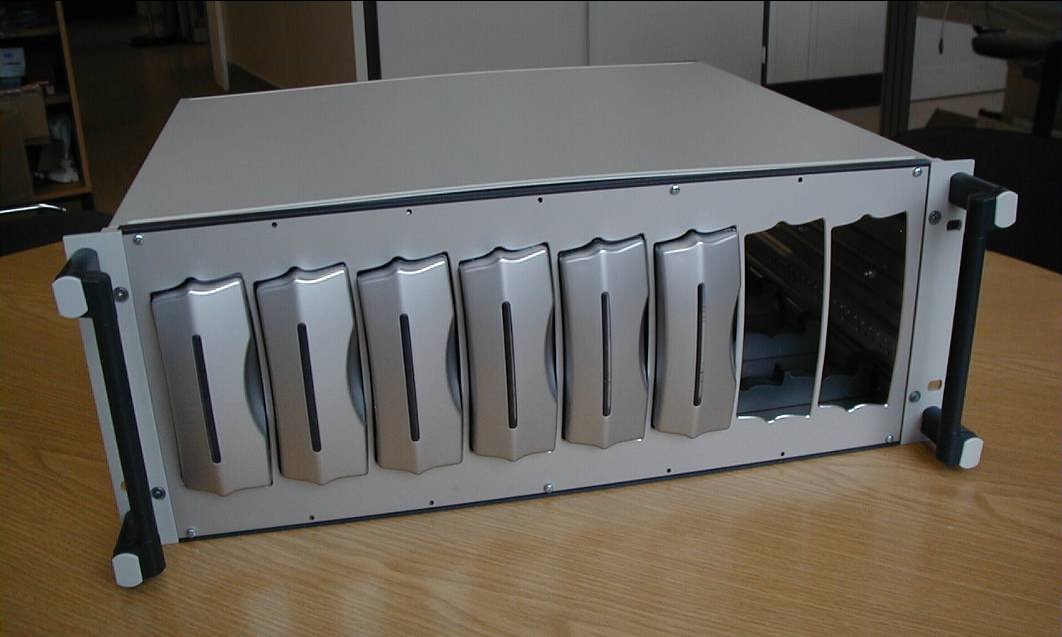
The parts for the full 14 channel version of the DCU were purchased in a late phase of the project, since prices Ż particularly for digital components Ż tend to become cheaper over time. This was important for the hard disks for data storage array, where we got optimum storage capability for the given budget. The storage disks were mechanically integrated into the system by a special constructed rack, allowing the single disks easily to be removed for transportation to FGFAN. In addition, a fan based cooling system was integrated, which increases the reliability of the hard disks (Figure 38).
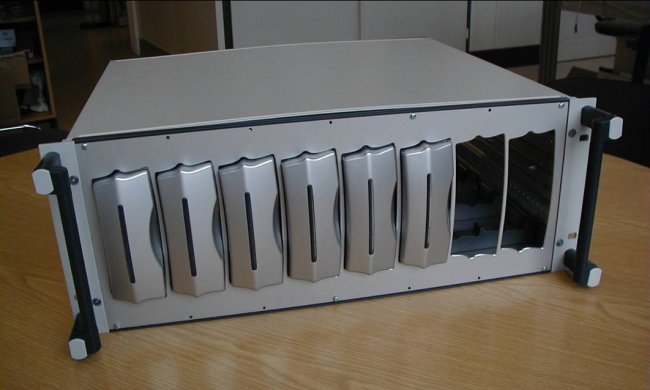
Figure 38: Photo of the storage array, which consists of 8 single hard disks with a capacity of 400 GB each.
3.2.2 WP3200 Hardware Integration of the DCU:
For accurate time synchronisation and time stamping of the data flow a special time-sync board was developed (Figure 39). It derives the GPS time information distributed via an IRIG-B signal from the central station clock. In addition, this board monitors the temperature of two ICS-554 boards and is able to switch parts of the DCU off to avoid hardware damage in an emergency case. Four time-sync boards were developed and successfully tested in the DCU-PCs.
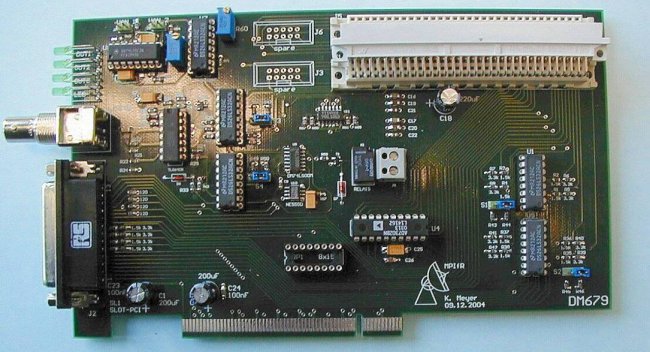
Figure 39: Photo of the IRIG-B time-sync board
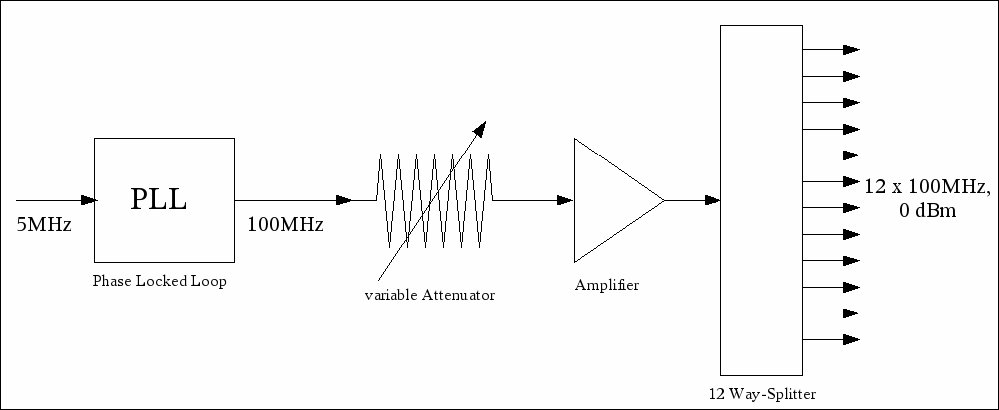
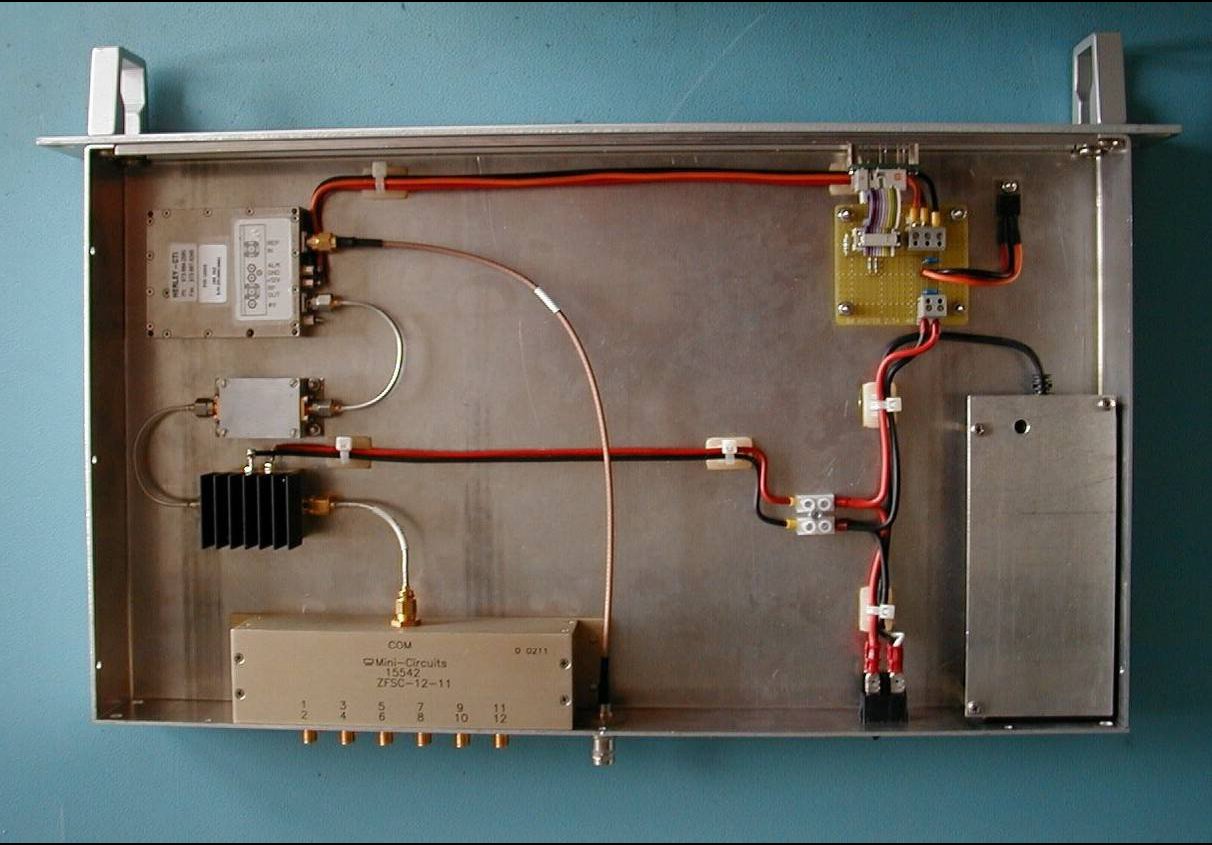
To synchronize the ADCs with the stations hydrogen maser clock, an Up-Converter Crate (UCC) was developed, which converts the 5 MHz station clock up to 100 MHz. This clock is amplified and finally distributed to all ADCs. The UCC is complete assembled and was successfully tested (Figures 40 and 40).
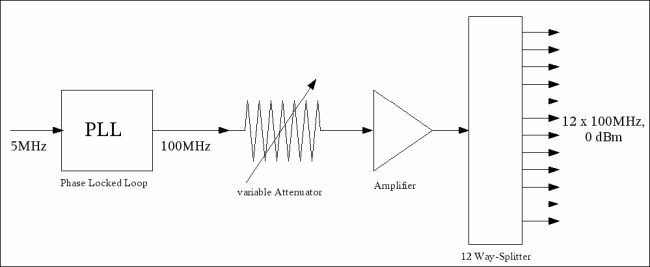
Figure 40: Schematics of the 5 to 100 MHz Up-Converter Crate (UCC)
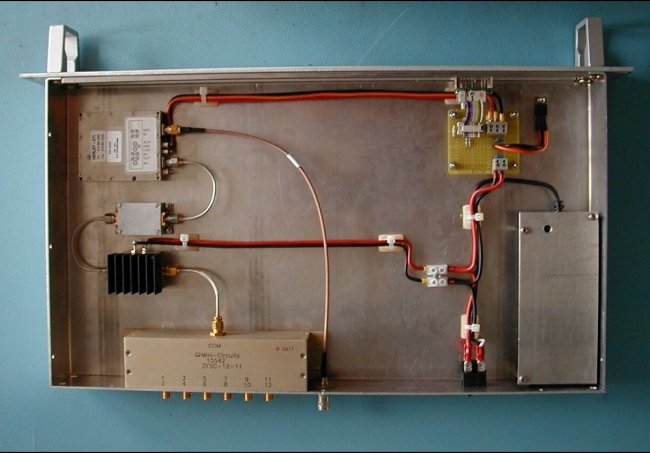
Figure 41: Photo of the opened 5 to 100 MHz Up-Converter Crate
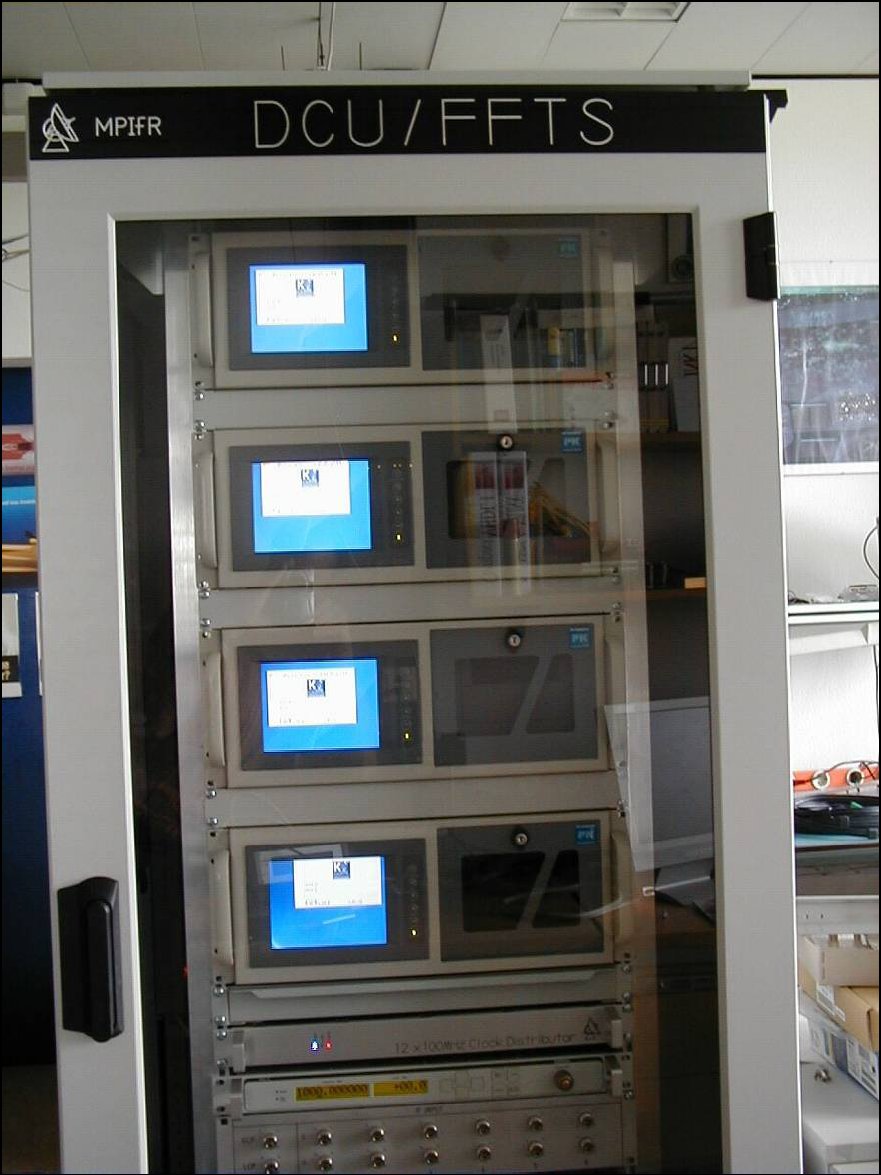
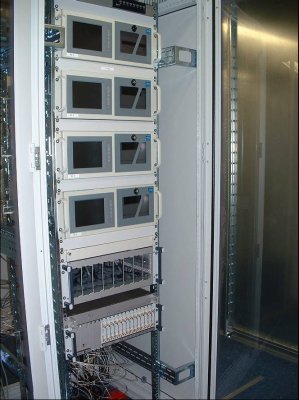
Figure 42 shows the final 19” DCU rack including four PCs, the 5 to 100 MHz Up-Converter and the N-connector patch panel at the digital laboratory in Bonn. All four PC systems had been configured with Linux and were successfully tested in the lab in Bonn to work properly with the data acquisition boards before delivering them to the Effelsberg station.
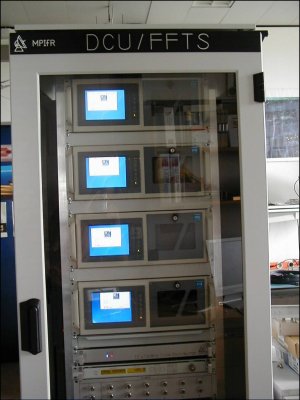
| Figure 42: | DCU rack including four PCs with integrated control monitors, the 5 to 100 MHz Up-Converter Crate (UCC) and the Receiver-DCU connection plate. |
3.2.3 WP3300 Hardware Test of DCU:
Due to the very promising results from the prototype DCU no significant problems were expected and the overall hardware review of the DCU in Bonn showed no significant problems.
3.3 WP4000 FPGA Configuration
3.3.1 WP4100 Configuration Software Purchase
A development software package to configure the FPGA on the data acquisition boards was purchased and tested. Since the final DCU software runs under a Linux kernel 2.6 an upgrade of the kernel modules for the ICS-554C/E boards used in the prototype was performed. Because the FPGA download/programming was very slowly by using the original delivered software package, a new download tool was developed, able to decrease the FPGA download time down to ~1 second.
3.3.2 WP4200 Development of Configuration Routines
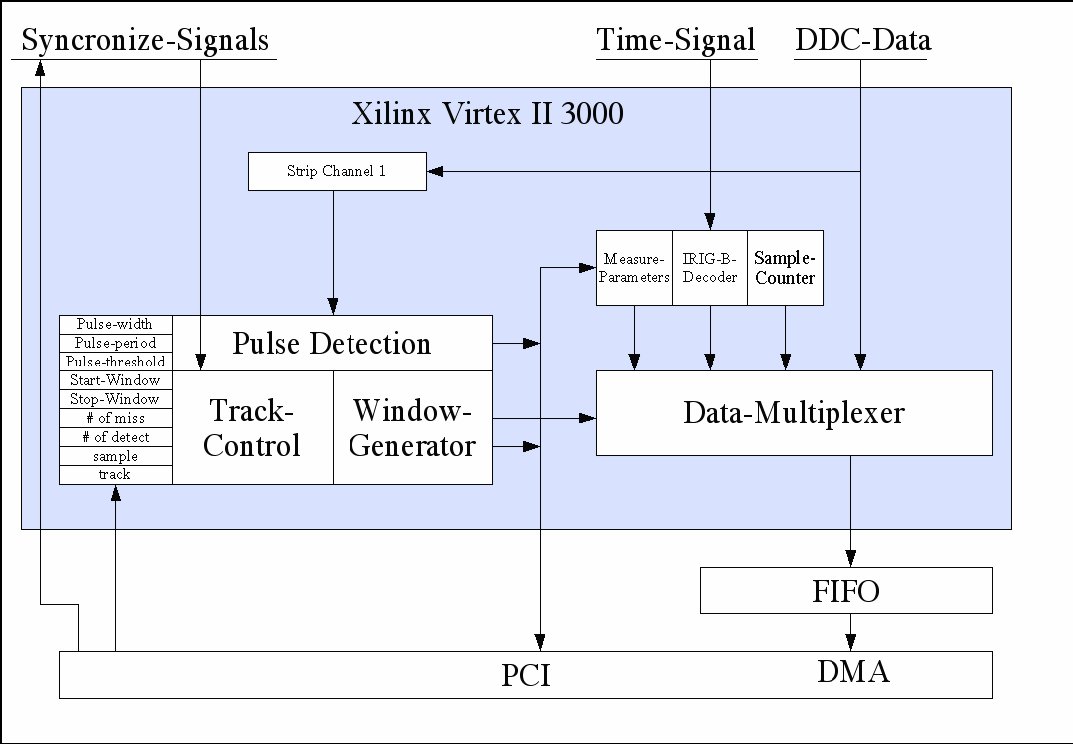
Using the DCU prototype, the FGPA on the data acquisition boards was configured along the requirements for use as a data collection unit together with the new multi-beam receiver for beam-park experiments. In detail, an early-/late-gate transmission pulse detection algorithm was implemented, which switch automatically in pulse-tracking mode, once the TIRA pulse is repeated confirmed. Based on the pulse detection and tracking two windows are triggered, which controls the data flow to the storage system. In this way, it is possible to collect only the data for the transmission signal and the received reflection. A block diagram of the FPGA configuration is shown in Figure 43.
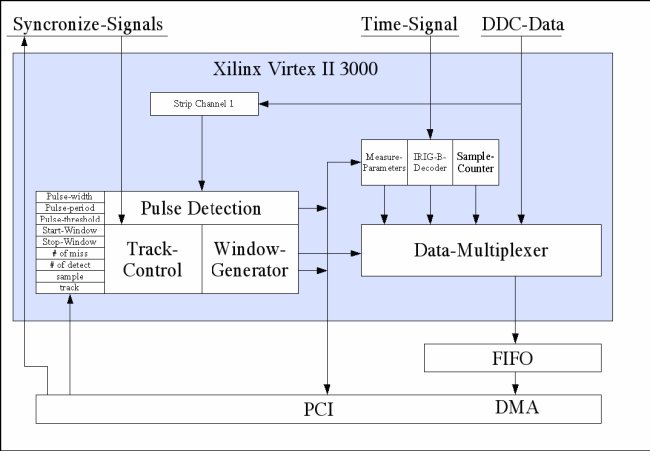
Figure 43: Block diagram of the final FPGA configuration
The timing dependencies of the early-/late gate detection algorithm are illustrated in Figure 44. Many of the several window parameters are flexible programmable during processing from the PC side.
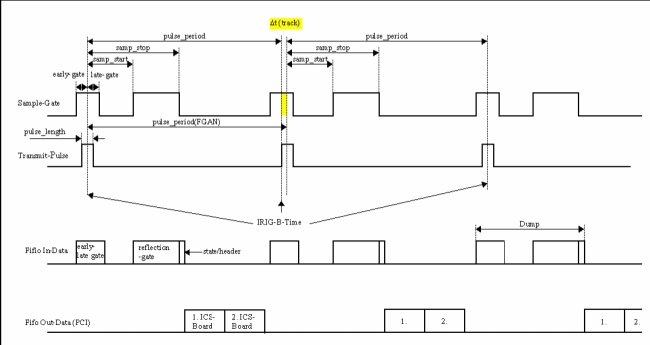
Figure 44: Timing diagram of the early-/late-gate pulse-detection and pulse-tracking algorithm
One important issue for the DCU is a synchronous start of all four PCs. Due to the fact that a Linux-based PC has no strict real-time behaviour, a hard wired start of the PCs was realized. Figure 45 shows the block diagram of the sync- and start-logic.
| Figure 45: | Block diagram of the hardwired sync- and start logic of the four PCs. In this figure PC1 is master and therefore responsible to synchronous the three other PCs during start of the measurement. |
3.4 WP5000 Integration and Test of the BPE Receiver System
3.4.1 WP5100 Software integration
To setup and control the ADC/FPGA boards and the whole data recording, software with a graphical user interface (GUI) was developed in C++/LabView for the DCU. A screen shot displaying the main control window is shown in Figure 46. Purpose of this graphical user interface, which was developed to fit to the small control TFTs on front of each PC, is to control und monitor the data acquisition during beam park experiments. The parameters for both ADC/FPGA boards can be adjusted separately. In addition, the reception of the TIRA transmit pulse can be real-time monitored in the lower half of the GUI together with important system parameters like the amount of free disk space. Due to the compact size of the GUI, it is possible to forward the whole GUI by a network connection to a PC outside the Faraday room for an easy control of the DCU during a PBE experiment. This work was not a topic in the contract but it turned out to be very useful for testing purpose. Furthermore this GUI enabled a first beam-park experiment immediately after the system test and independently from FGAN data collection software.
3.4.2 WP5200 Overall system test at Effelsberg
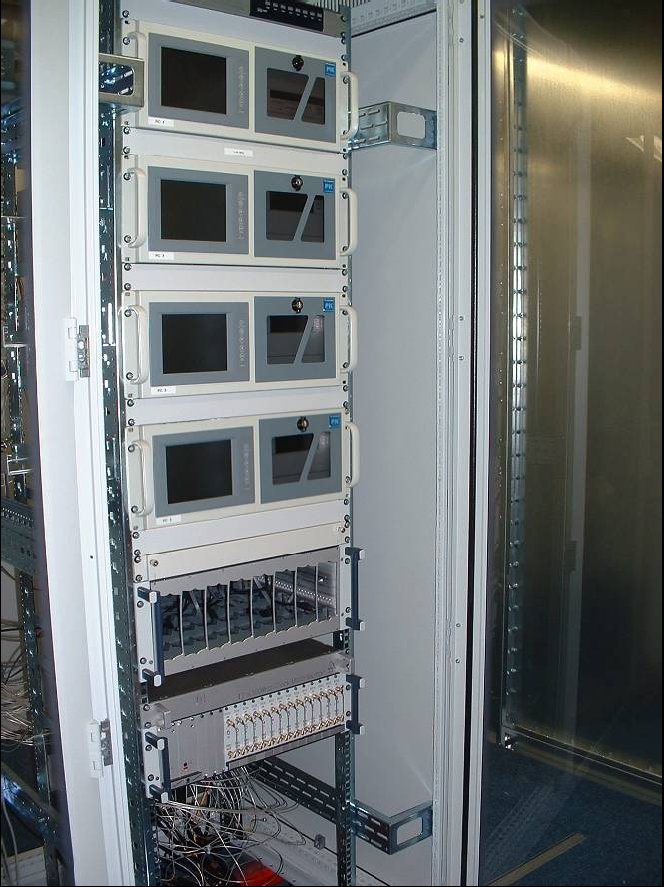
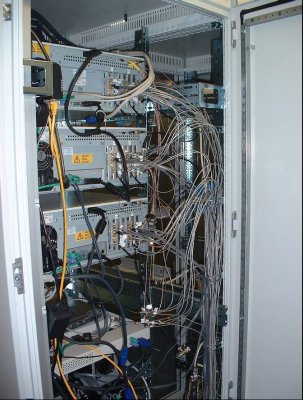
The final integration of the complete DCU rack was done in the Faraday room at Effelsberg. Only at this place, the whole infrastructure was available and therefore the final review of the DCU took place there. All IF levels were adjusted for an optimal ADC sampling and the redundancy wiring was installed (Figure 47). By using the TIRA transmit pulse, the receiver/DCU system was verified. The important time synchronisation was tested together with the pulse detection and this works as expected. In a first calibration experiment on June 25. 2006, the complete receiving system was tested and successfully verified.
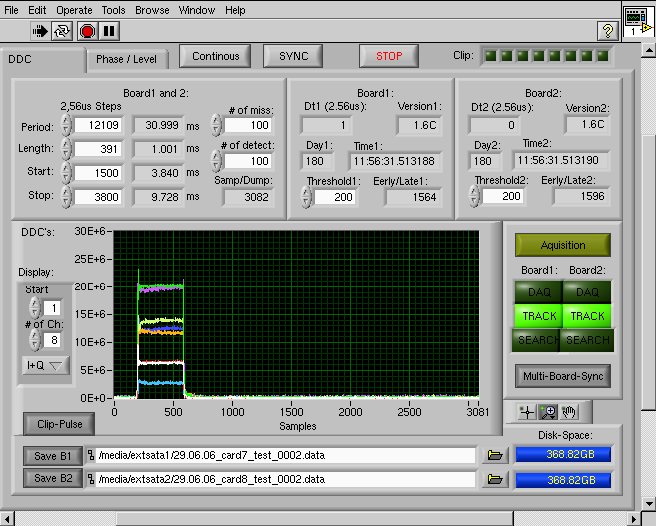
Figure 46: Screen shot of DCU control GUI.
|
|
| Figure 47: Pictures of the DCU installation in the Faraday room at Effelsberg. The DCU is cooled by a central climate control system, which blows a cool air flow from bottom side into the rack. |
4. Conclusion
We developed and realised a complete new multi-beam receiving and data acquisitioning system for advanced bi-static radar experiments. The work done under this contract comprises a sophisticated, cryogenic receiver developed according to radio astronomy needs. Seven beams with 0.16° beam width and two polarizations each are scanning the sky at a distance of about 0.25°. A new and flexible data collection unit with bandwidth of 50 MHz is able to sample all 14 intermediate frequency channels in parallel and real time and store it onto hard disks to be carried to FGAN.
The hardware was designed to be compatible with the FGAN TIRA radar system to provide full compatibility of the measured data. Together with the FGAN TIRA the system is able to measure space debris particles down to the cm regime in 800 to 1000km height. In a first beam-park experiment on 29. /30. June we demonstrated that the system meets the requirements. First results were published on the IAC 2006 conference in Valencia [5]. The receiving system is now available for future ESA beam-park experiments with TIRA.
5. References
| [1] | L. Leushacke, Dieter Mehrholz, Rüdiger Jehn: “First FGAN/MPIfR cooperative Debris Observation Campaign: Experiment Outline and First Results”, Proc. Of the 2nd European Conference on Space Debris, ESA/ESOC Darmstadt, Germany, 1997, pp. 45-50. |
| [2] | Bernd Klein, Guido Bartsch, Reinhard Keller, Ludger Leushacke: “Improved Systems for Bistatic Beam-Park Experiments”, COSPAR, Paris 2004. |
| [3] | http://www.mpifr-bonn.mpg.de/div/electronic/7beam21cm.html |
| [4] | Guido Bartsch, Bernd Klein: “A Flexible Digital Receiver Architecture For Space Debris Measurements, Astronomy and Space Reconnaissance”, Proc. Of the 4th European Conference on Space Debris, ESA/ESOC, Darmstadt, Germany 2005, pp. 627-630. |
| [5] | Guillermo Ruiz, Ludger Leushacke, Rüdiger Jehn, Reinhard Keller: “Improved FGAN/MPIfR Bi-Static Debris Observations Campaign: Experiment Outline, Analysis Algorithms and First Results”, IAC 2006, Valencia, Spain. |
| [6] | Michael Reppel: “Novel HTS Microstrip Resonator Configurations for Microwave Bandpass Filters”, Dissertation an der Gesamthochschule Wuppertal, Germany 2000. |
6. Annex
6.1 Block Diagram of the receiver
6.2 Waveguide window materials
| Material |
Dielectric const. |
Water vapour trans. |
Oxygen permeability |
Helium permeability |
Losses (tan-d) |
Outgasing rate hour (10h) |
| PTFE Goretex RA-7957 |
2.1 |
0.3 |
|
|
|
low |
| Polyethylene |
2.26 |
1 |
500 |
|
|
2.6*10e-7 |
| Mylar |
3.0 |
1.8 |
6 |
|
|
3*10e-6 |
| HR500/2S (Hercules) |
2.1 |
|
|
|
|
|
| PTFE/ Teflon |
2.1 |
|
|
|
0.3 |
2.1*10e-7 |
| Ceramic Wesgo Al 995 |
5.0-9.8 |
|
|
|
0.3 |
1*10e-9 |
| PTFE/ Ceramic |
3.0 |
|
|
|
10e-5 |
|
| Fused Quartz |
3.7 |
|
|
2*10e-10 |
< 4*10e-4 |
Low |
| Diamond (CVD) |
5,67/144GHz |
|
|
|
2*10e-5 |
|
Table 2: Waveguide window materials.
6.3 Couplings of Feed Horns
Cross Coupling at Horns.
| Horn Nr./Pol. vs. Horn Nr./Pol. |
1,29 GHz |
1,43 GHz |
Distance of Short Plate: |
| 4 V | 7 V | 24 dB | 26 dB | without | isolated |
| 4 V | 7 V | 25 dB | 28 dB | 0 mm | isolated |
| 4 V | 7 V | 20 dB | 23 dB | 40 mm | isolated |
| 4 V | 7 V | 27 dB | 29 dB | 55 mm | isolated |
| 4 V | 7 V | 25 dB | 29 dB | 63 mm | isolated |
| 4 V | 7 V | 26 dB | 29 dB | 70 mm | isolated |
| |
| 3 V | 7 V | 33 dB | 29 dB | without | isolated |
| 7 V | 7 H | 43 dB | 49,5 dB | without | isolated |
| 4 V | 4 H | 46,5 dB | 34 dB | without | isolated |
| 1 V | 1 H | 46,7 dB | 37 dB | without | isolated |
| 2 V | 2 H | 42,7 dB | 35 dB | without | isolated |
| 3 V | 3 H | 58,5 dB | 41,5 dB | without | isolated |
| 7 V | 3 H | 31,6 dB | 39,7 dB | without | isolated |
| 7 V | 4 H | 54,6 dB | 56,8 dB | without | isolated |
| |
| 7 V | 4 H | 57,4 dB | 71,2 dB | 0 mm | isolated |
| 7 V | 4 H | 57,3 dB | 68,9 dB | 0 mm | contacted |
| 7 V | 4 V | 24,4 dB | 31 dB | 0 mm | contacted |
| 7 V | 4 V | 26,5 dB | 32,7 dB | 55 mm | contacted |
Table 3: Couplings of Feed Horns